MapaTrhu · Datenprodukt
Erst der Kontext. Dann die Entscheidung.
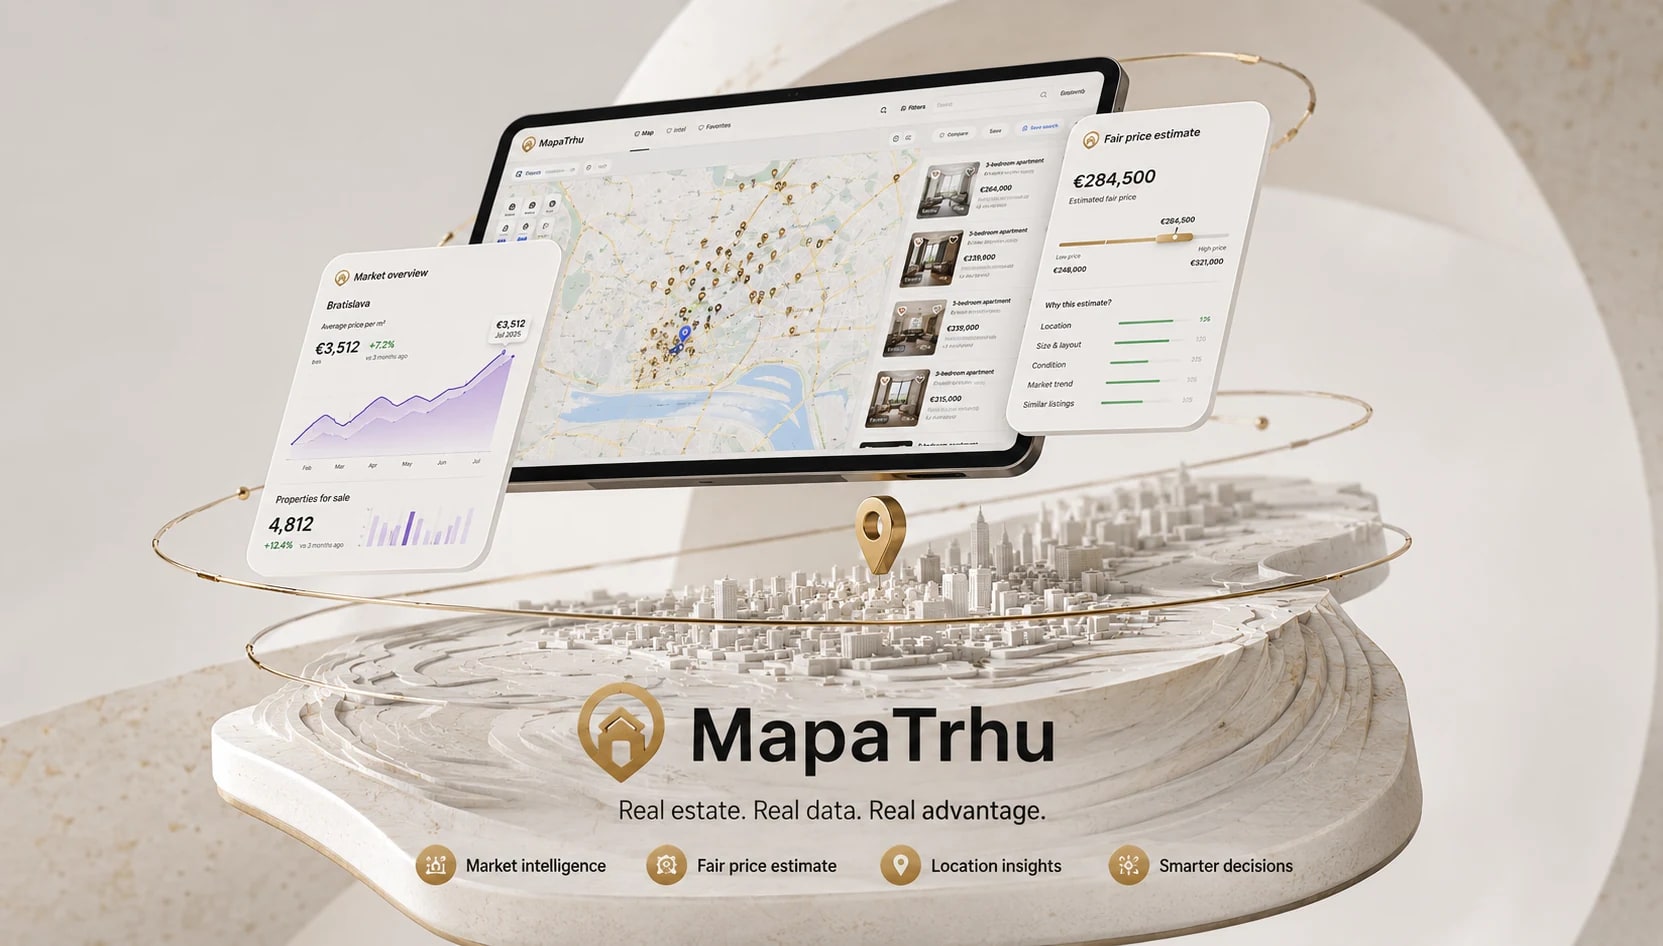
MapaTrhu bündelt Angebote aus mehreren Portalen, Preisentwicklung, Lagekontext und Vergleich in einem Arbeitsbereich für den Immobilienkauf.

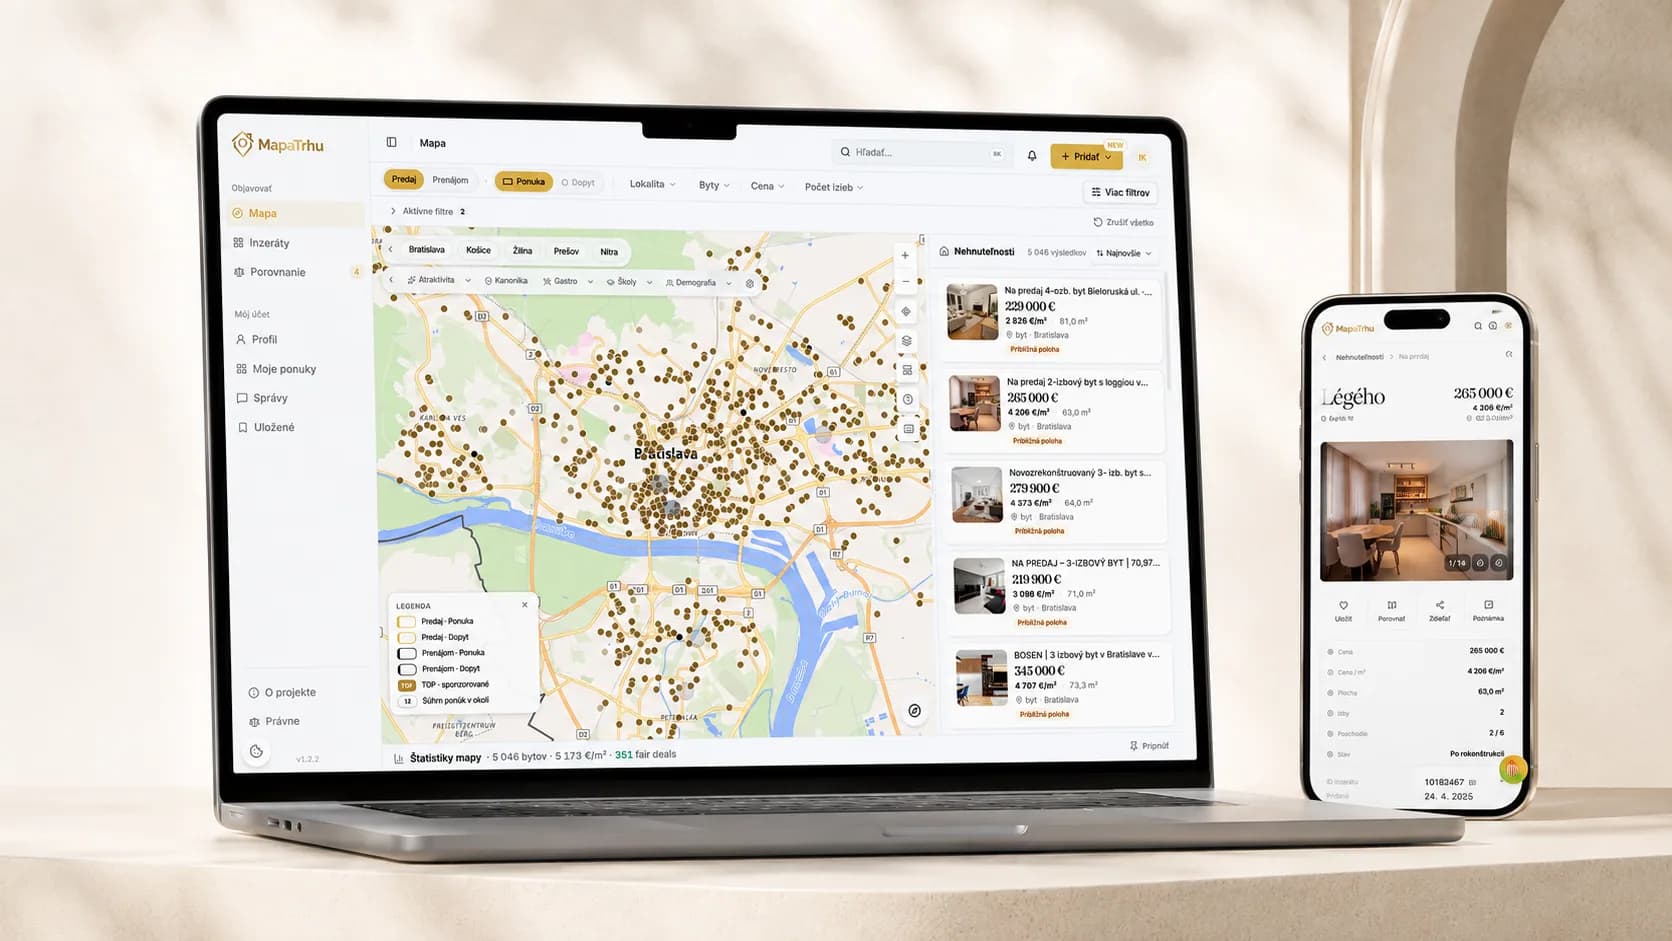
Decision journey
Five steps from the map to fair-price context.
The selected market stays put when a user opens a listing from the map. Price, locality and comparable offers load progressively, each one arriving at the moment it can inform the next decision.
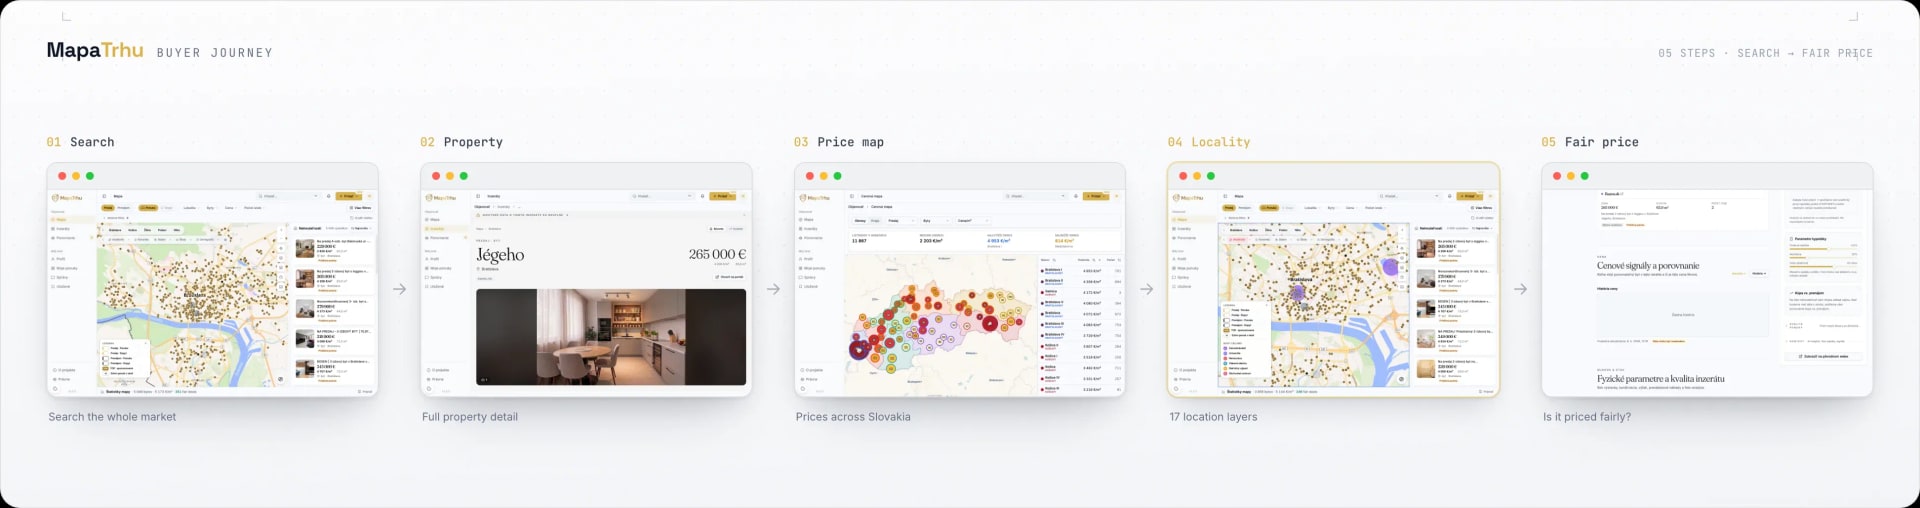
Scroll the diagram horizontally.
- 01
Search the market
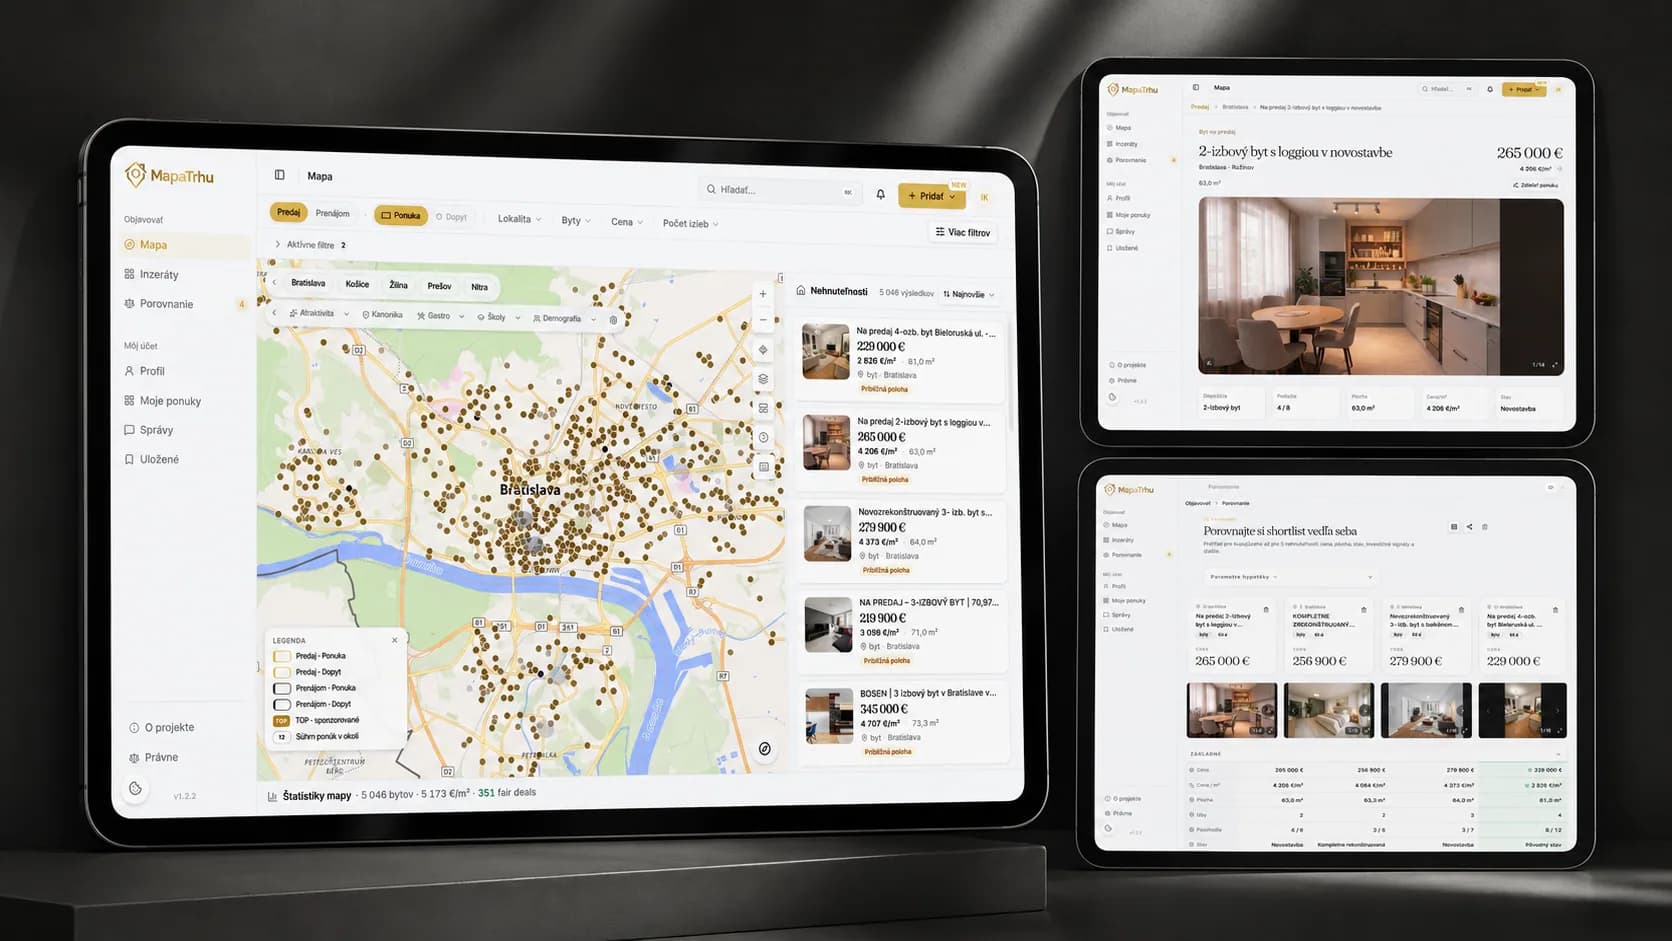
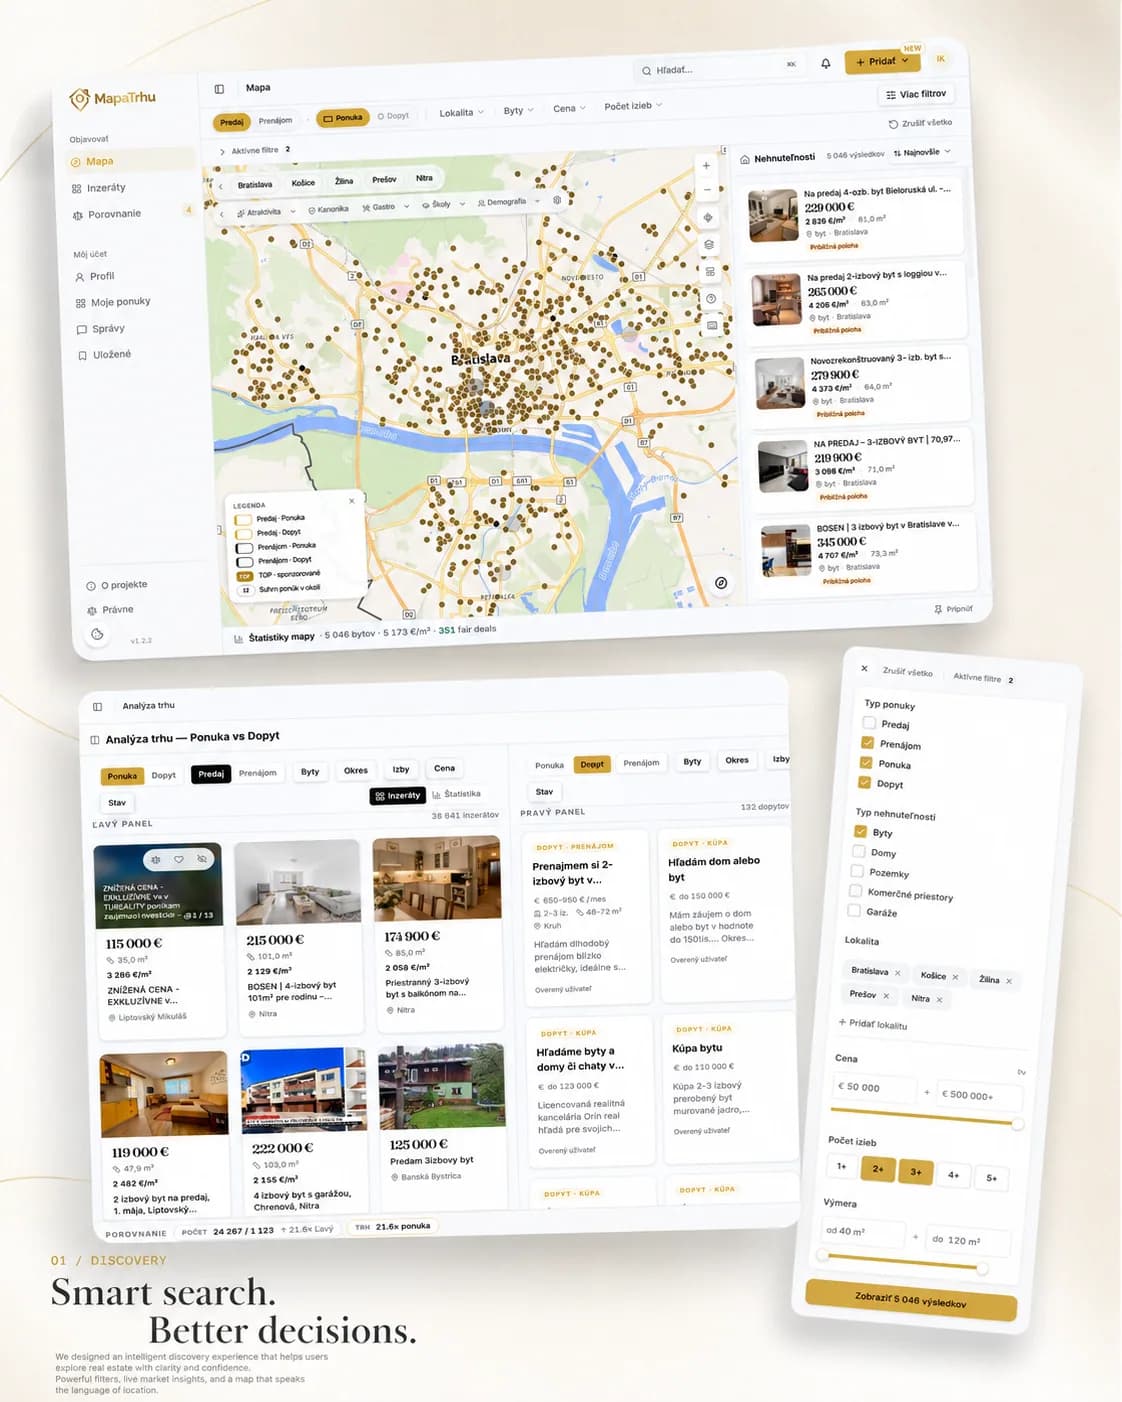
Listings from multiple portals share one map. Viewport and filters update the results together, keeping the visible market relevant.
- 02
Open the property
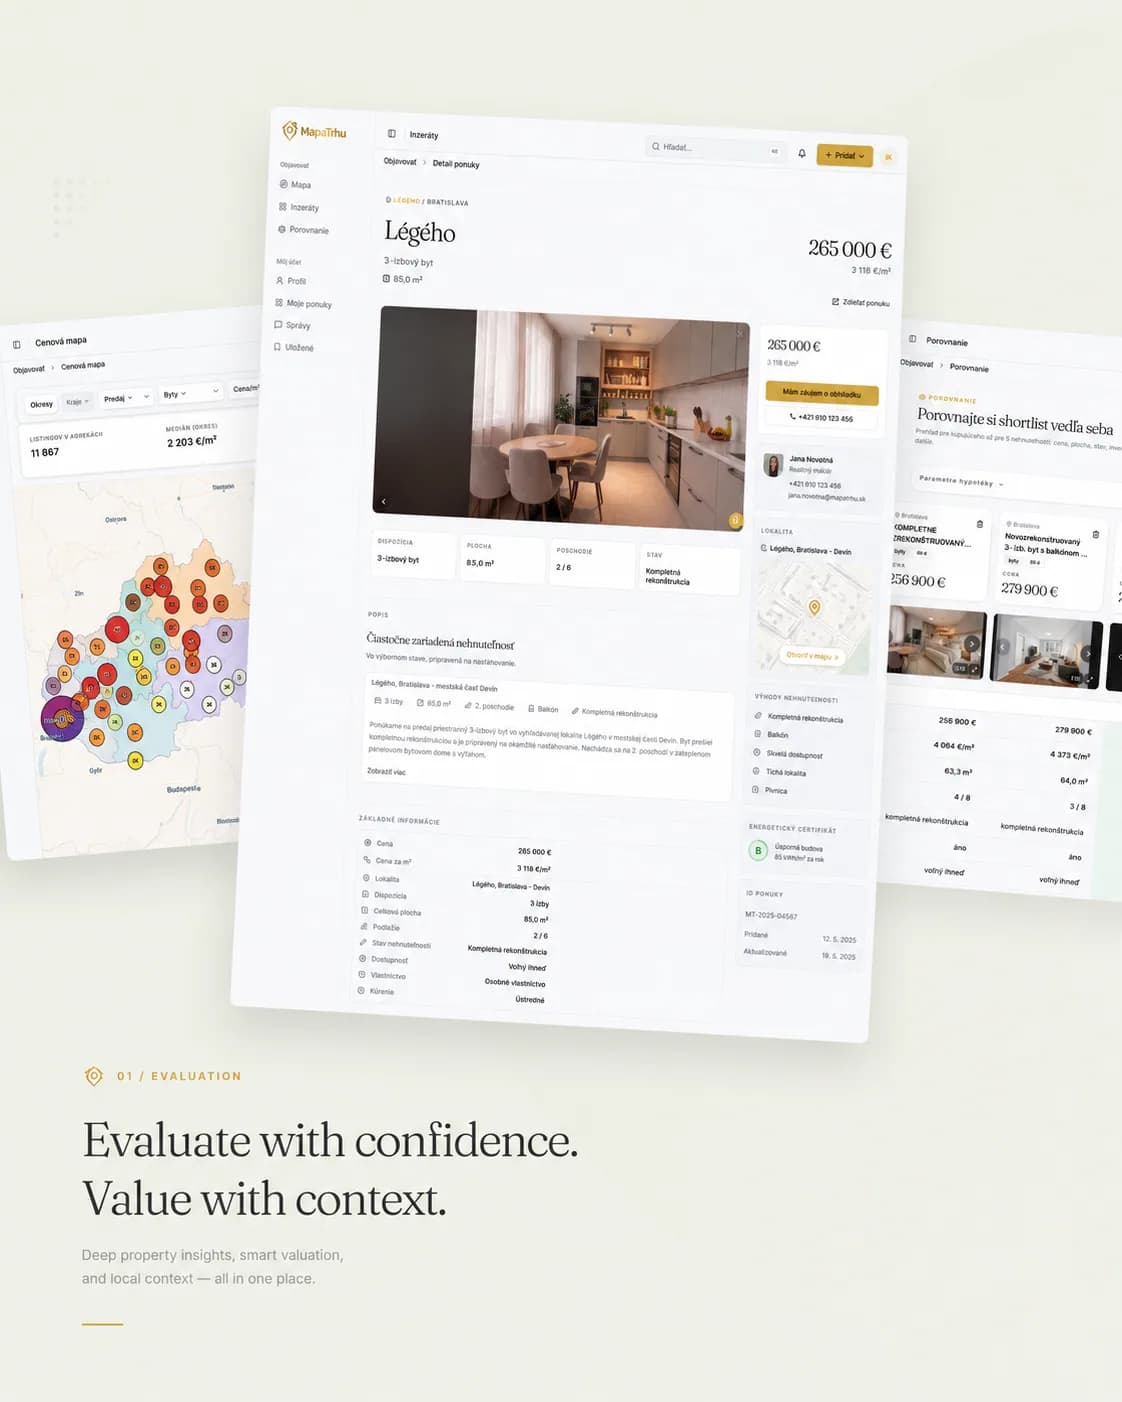
The detail keeps the selected area in context and adds source, price, history, attributes, and photos without returning to a stack of portal tabs.
- 03
Read the price map
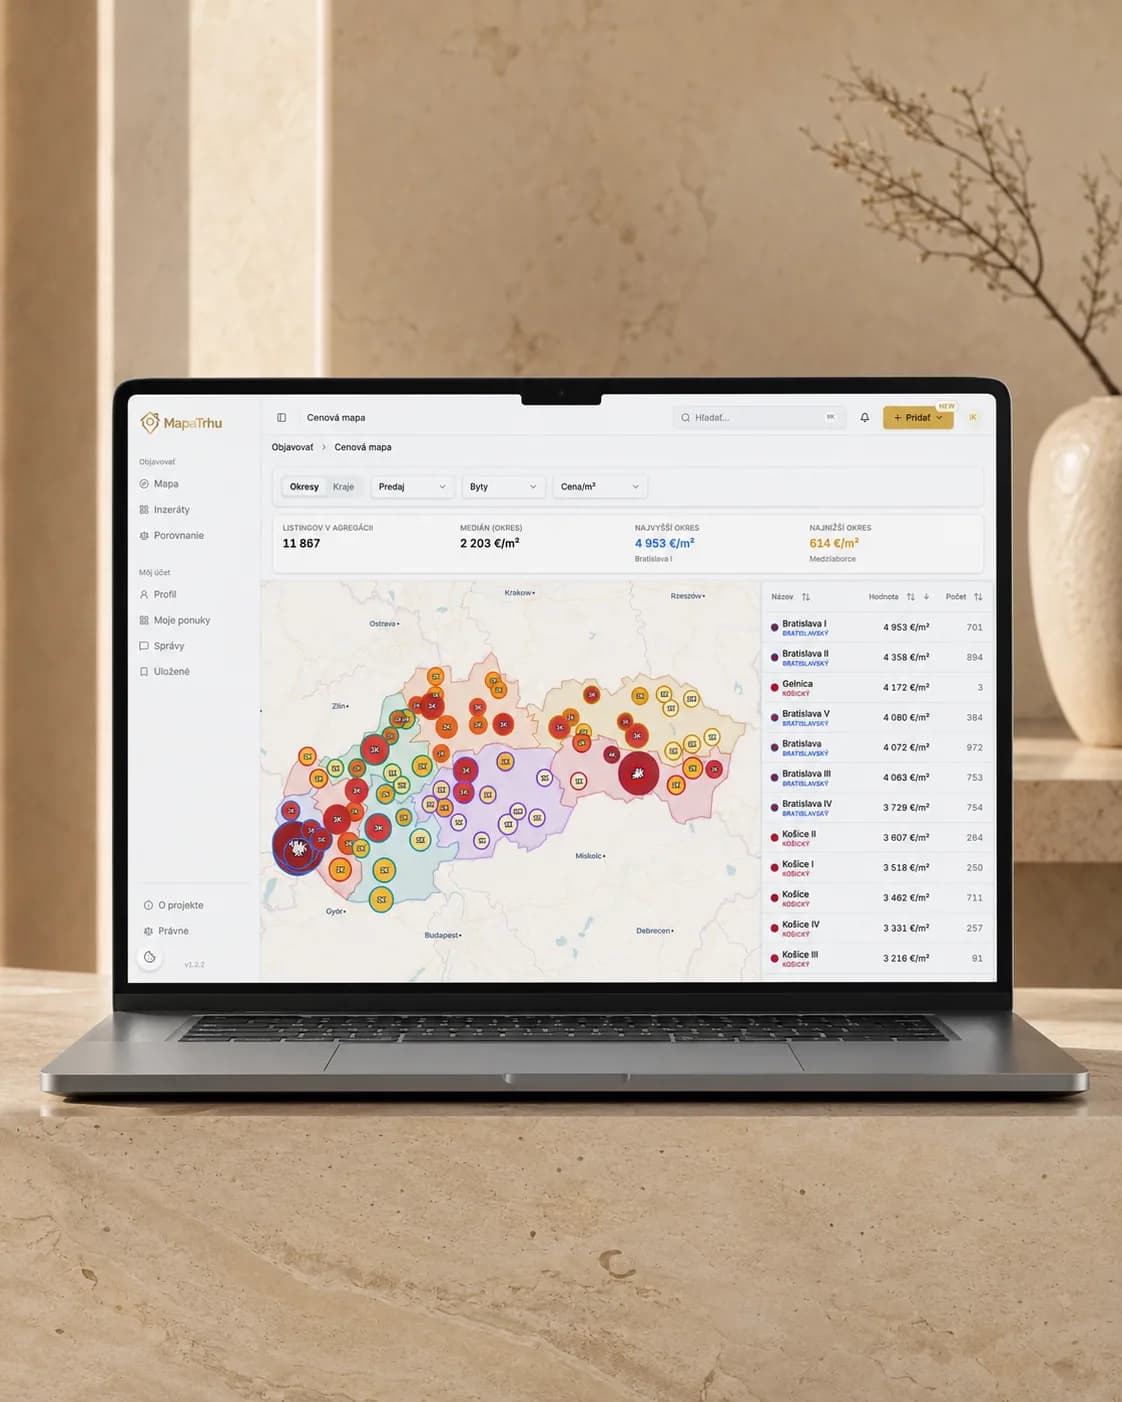
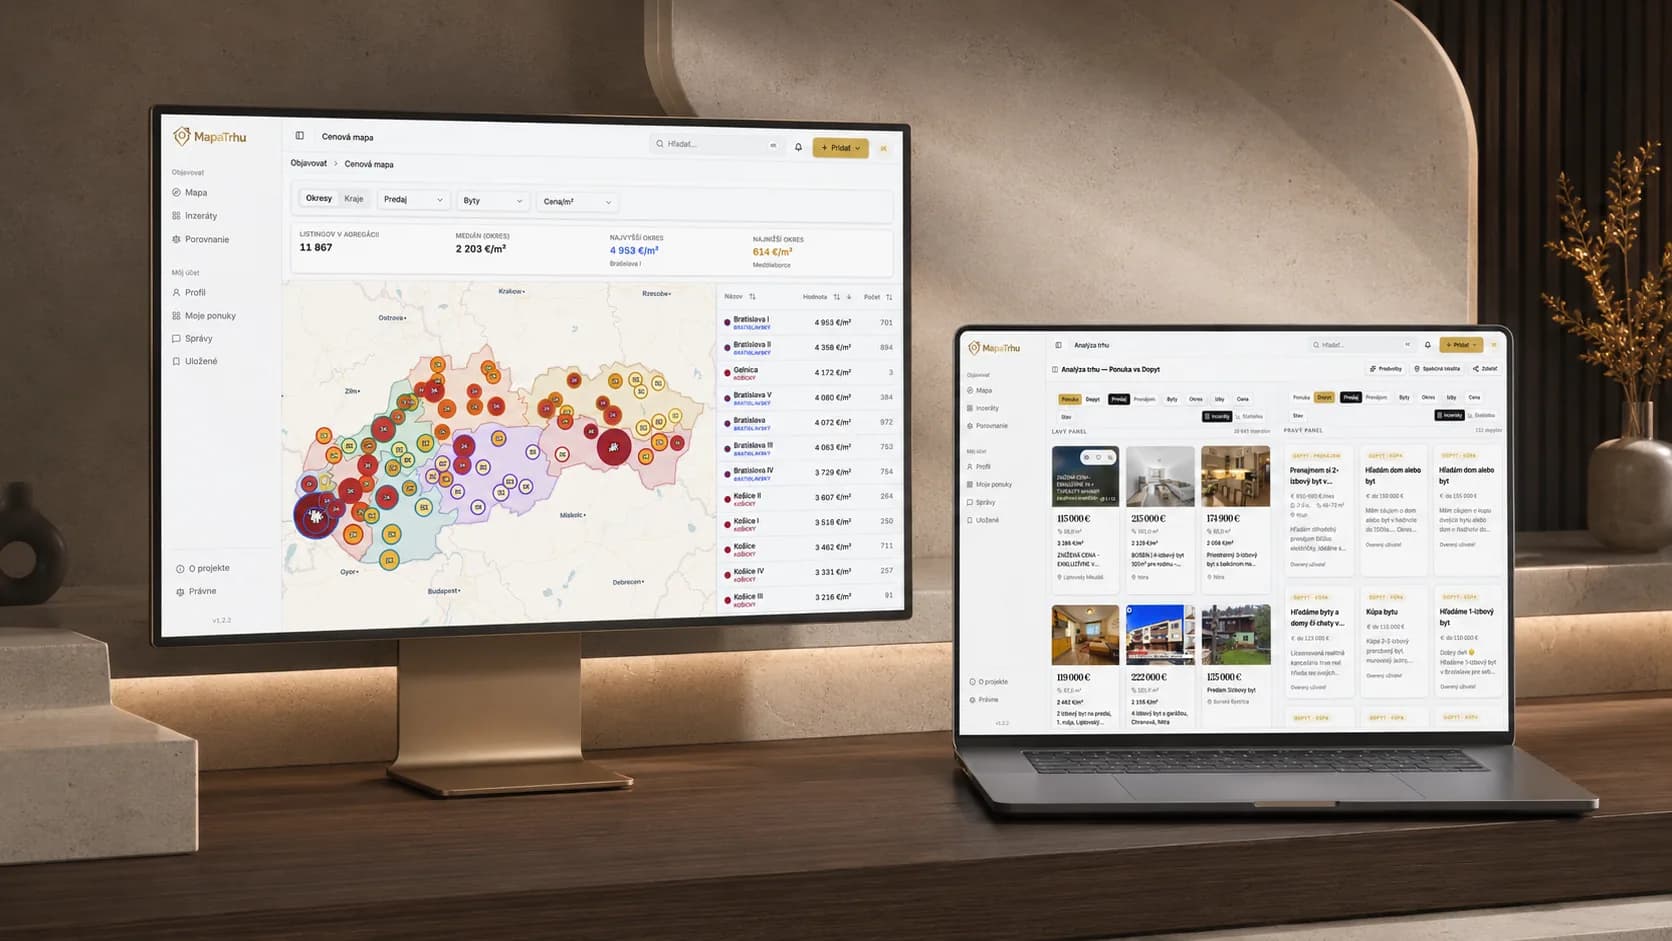
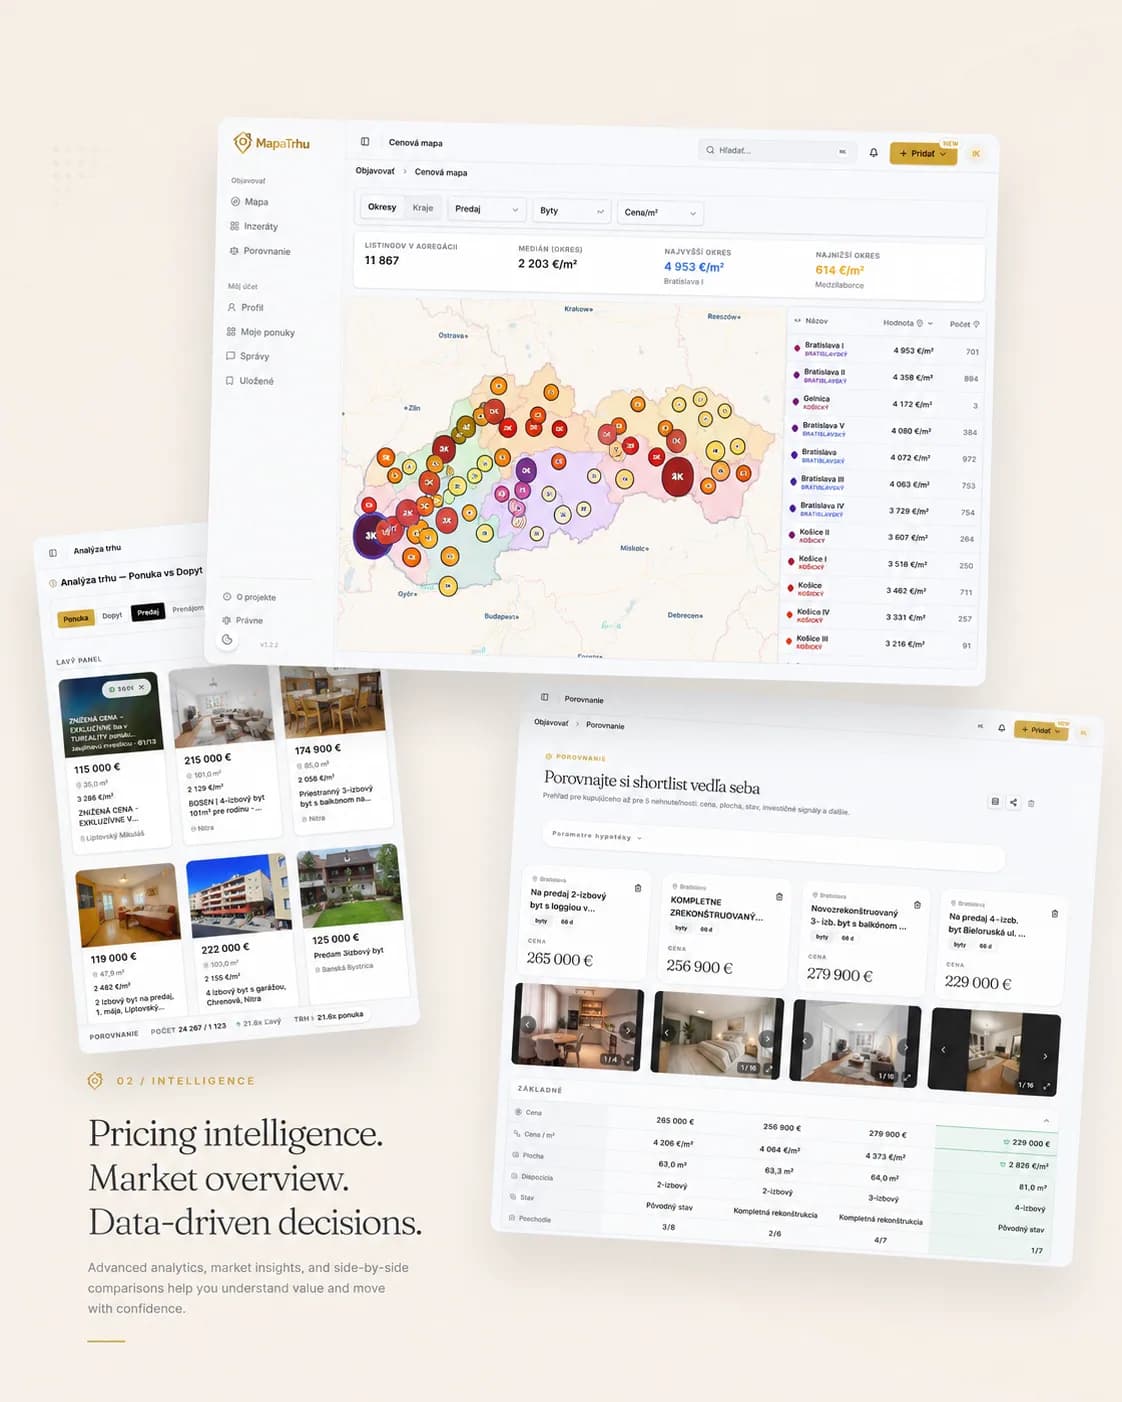
The price map compares districts and localities through a consistent price-per-square-metre view, giving one asking price a market frame.
- 04
Understand the locality
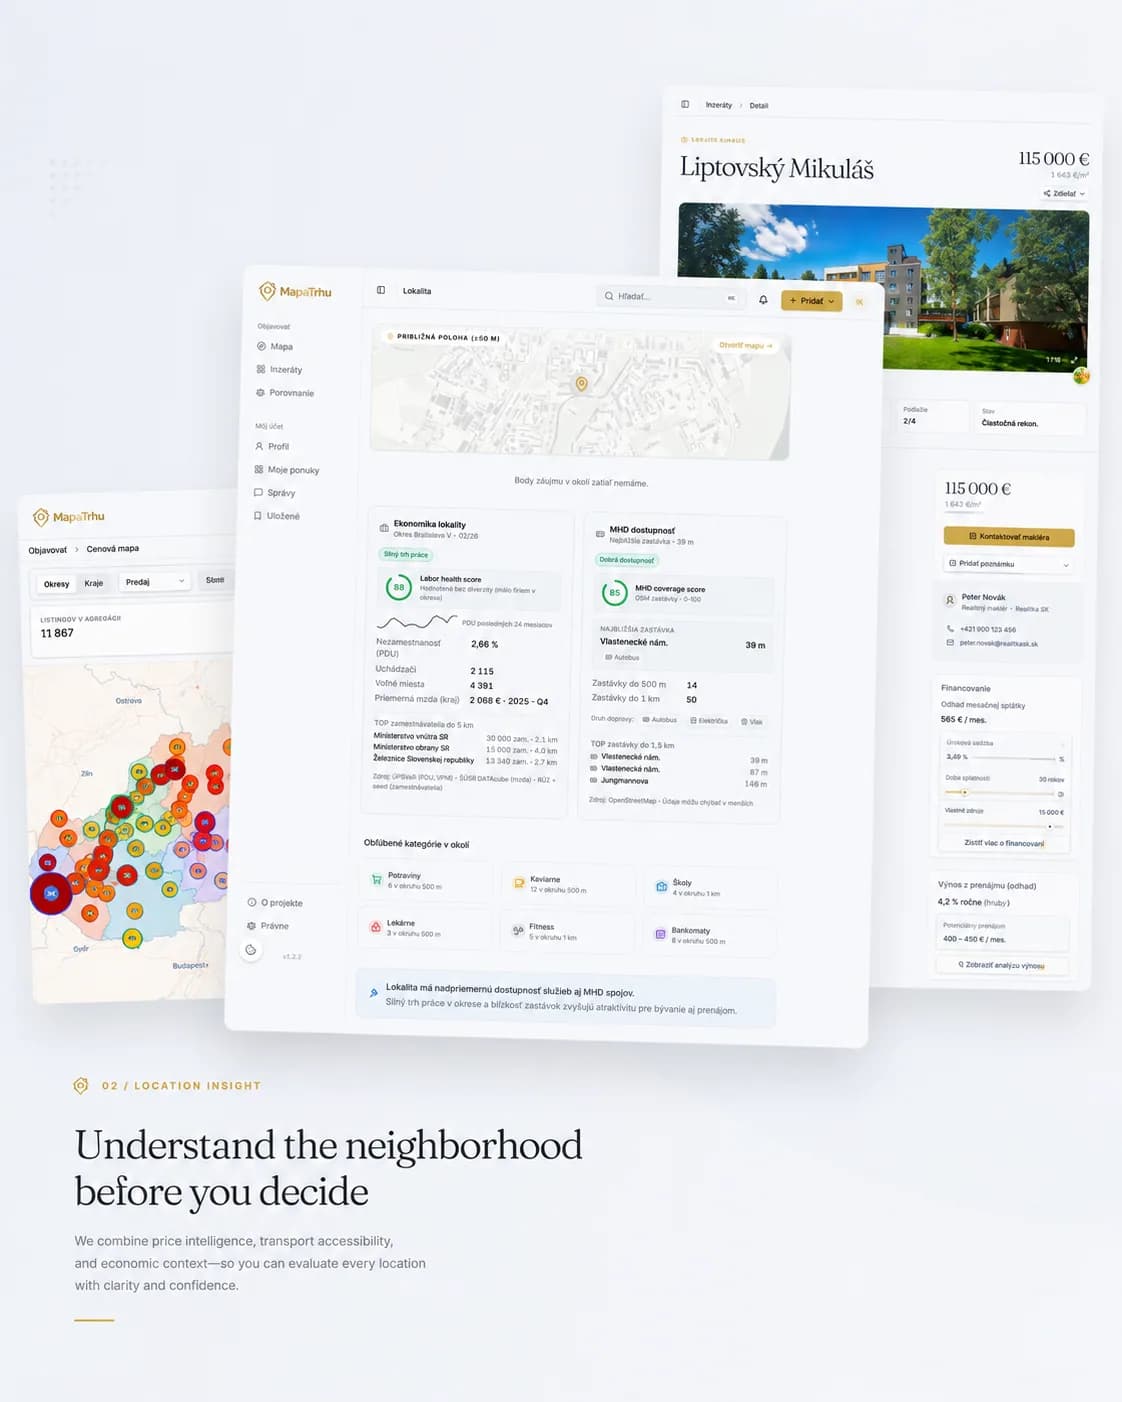
Seventeen optional layers add transport, parks, schools, demography, risks, services, and analytical signals directly to the map.
- 05
Check fair-price context
The estimate uses comparable price per square metre, time weighting, and data availability. It communicates context and confidence, not a guaranteed value.
Informationen
- Projekttyp
- Eigenes Immobiliendatenprodukt
- Plattform
- Öffentliche Webanwendung
- Unsere Rolle
- Wir haben das Produkt von Grund auf gebaut und betreiben es weiterhin, von der Angebotserfassung bis zur Kartenoberfläche.
- Status
- Live und kostenlos auf mapatrhu.sk
Technologie
- React 19
- TypeScript 6
- Vite 8
- MapLibre 5
- TanStack Query
- Zustand
- Tailwind CSS 4
- Paraglide
- FastAPI
- Python 3.14
- PostgreSQL 17
- PostGIS 3.5
- pgvector
- psycopg3
- Redis 8
- aiohttp
- Docker
- Caddy
Was Sie erfahren
- 01Wie Angebote aus mehreren Portalen verbunden werden, ohne ihren Verlauf zu verlieren.
- 02Wie die Karte bei wachsendem Datenvolumen lesbar und schnell bleibt.
- 03Wie Preis, Lage und Vergleich die Unsicherheit beim Kauf verringern.

01
Ein fragmentierter Markt
Eine Immobilie erscheint auf mehreren Portalen, mit unterschiedlichen Texten und ohne durchgängigen Verlauf. Käufer setzen ihr Bild des Marktes aus offenen Tabs, Tabellen und Eindrücken zusammen.
“Eine Kaufentscheidung braucht mehr als ein Foto und einen Angebotspreis.”

02
Die Karte als Arbeitsbereich
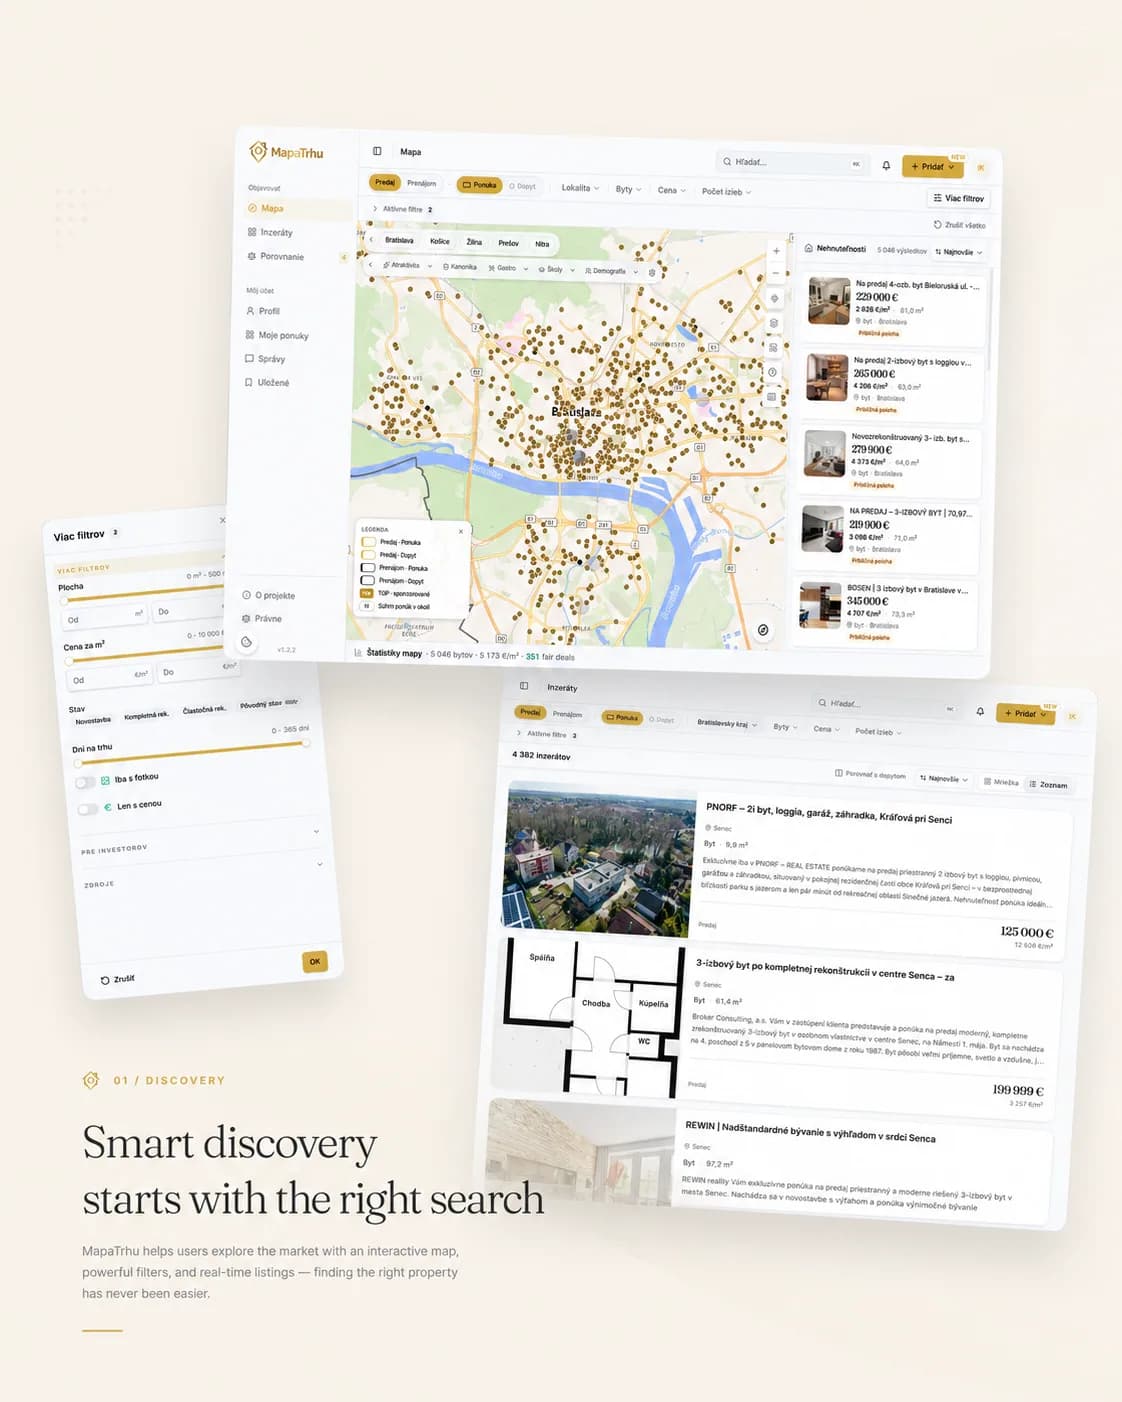
Die Karte ist der zentrale Arbeitsbereich. Beim Bewegen und Filtern ändern sich Punkte, Ergebnisse und Lageebenen gemeinsam, damit der Zusammenhang zwischen Angebot und Ort erhalten bleibt.
03
Der Preis braucht Kontext
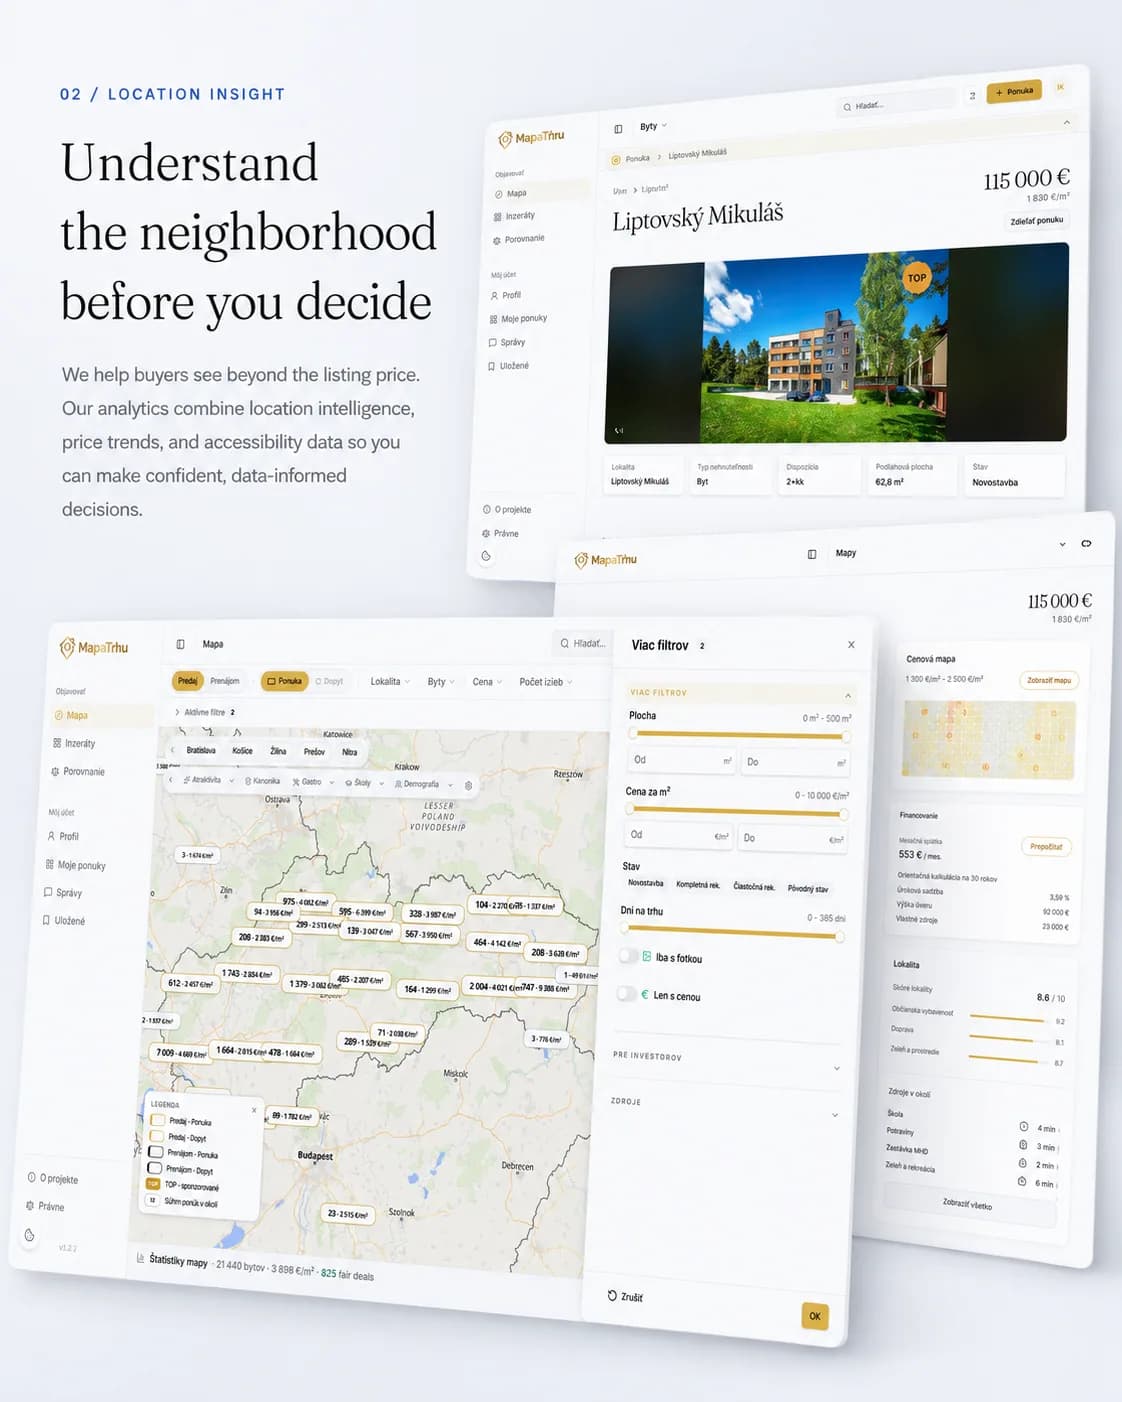
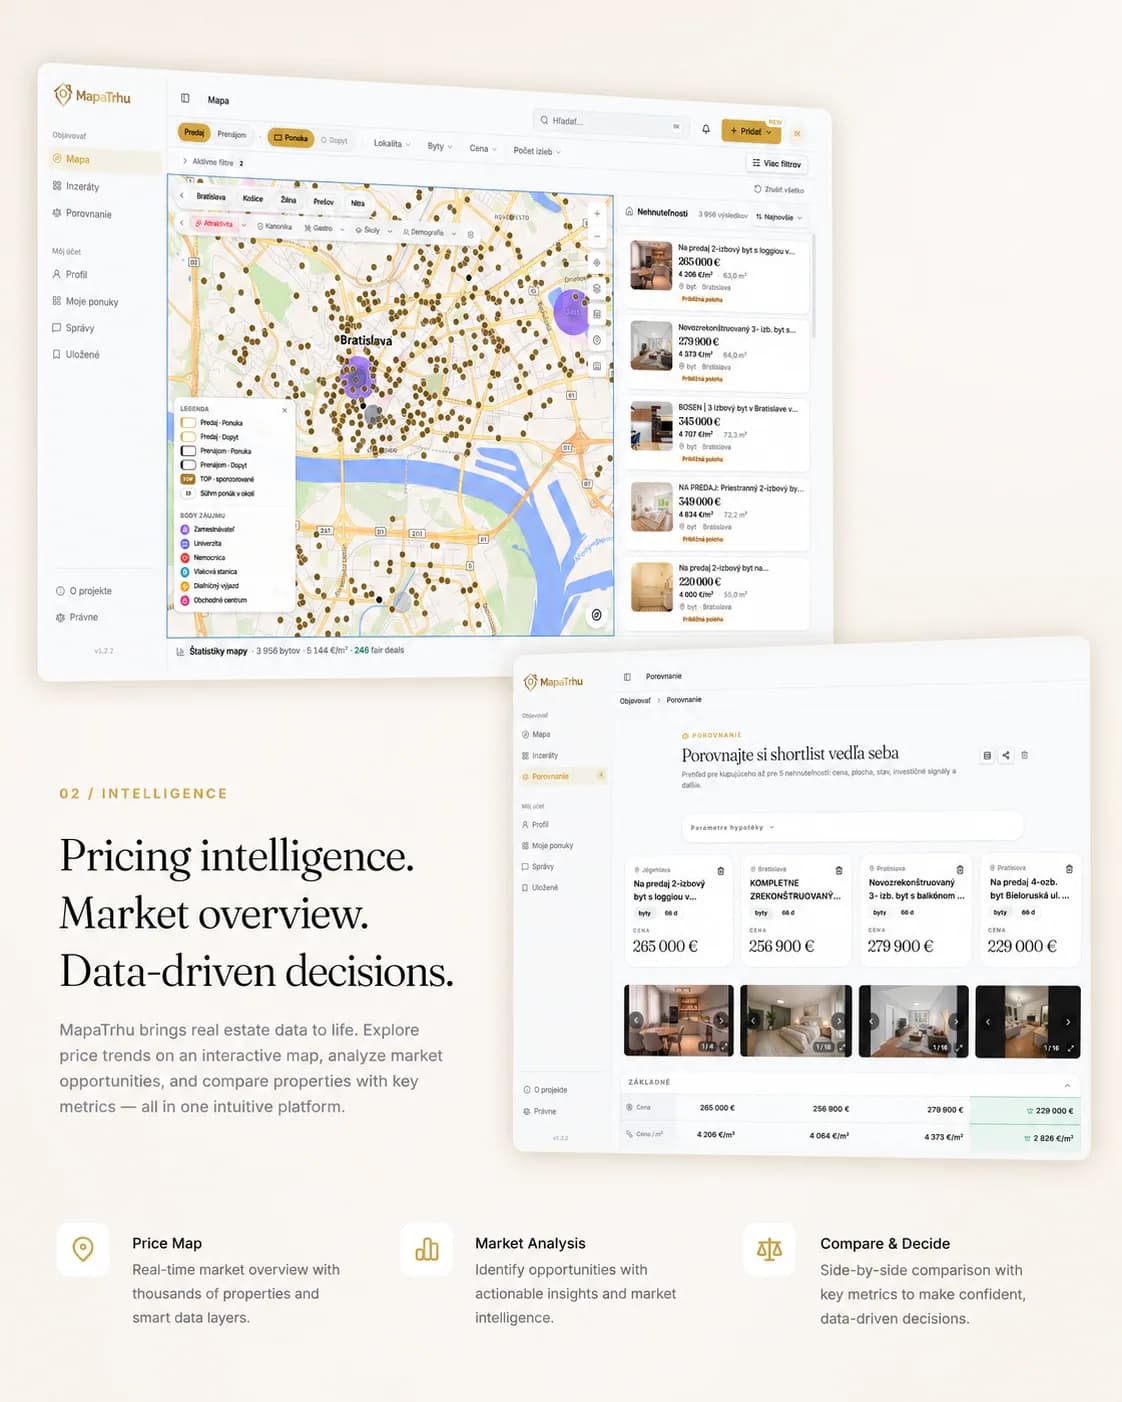
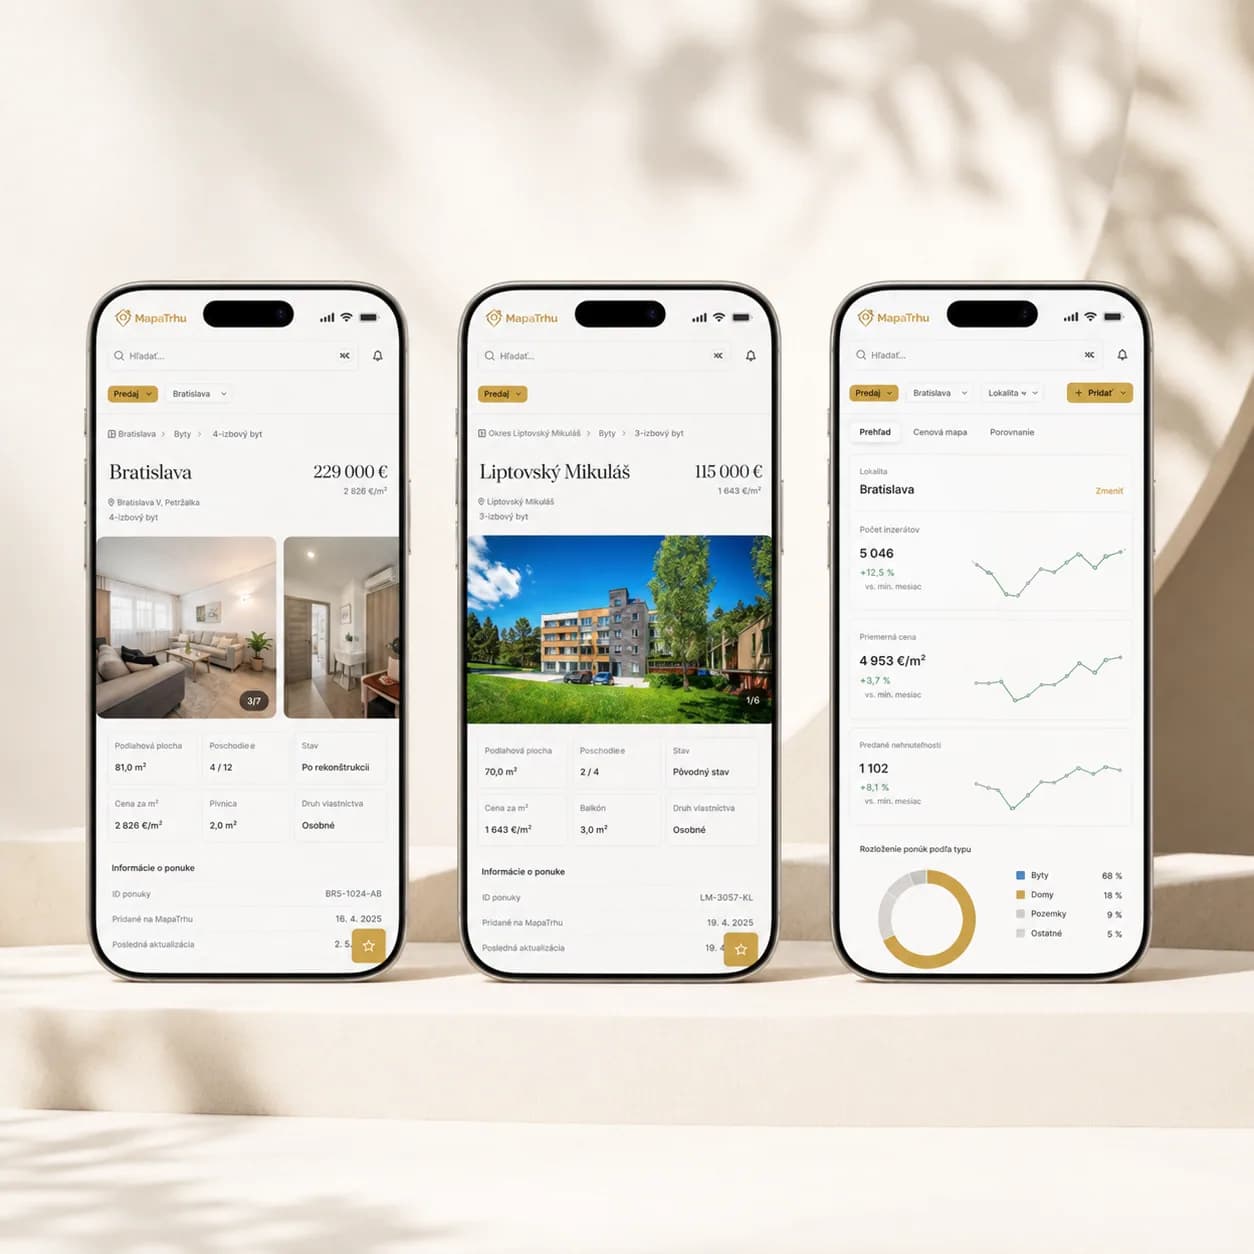
Die Preiskarte vergleicht Bezirke und Lagen. Im Detail kommen Preisentwicklung, Erreichbarkeit und Umgebung dazu. Eine Schätzung ist keine Gewissheit. Jede Zahl nennt Quelle und Vertrauensniveau.
04
Eine vergleichbare Shortlist
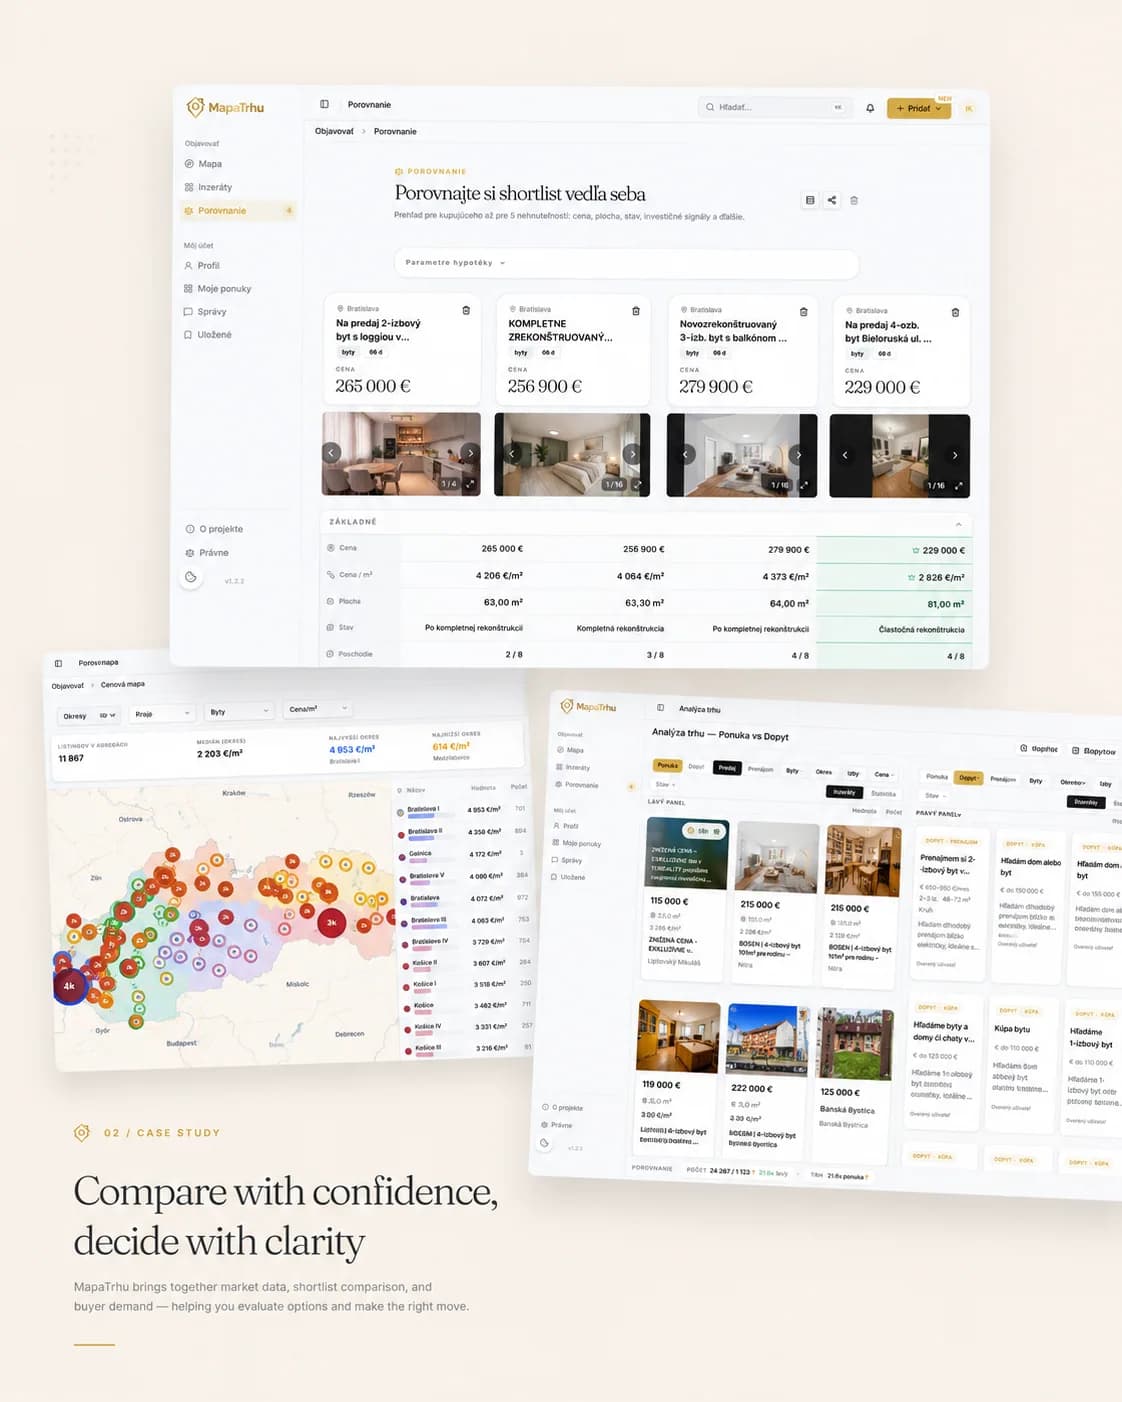
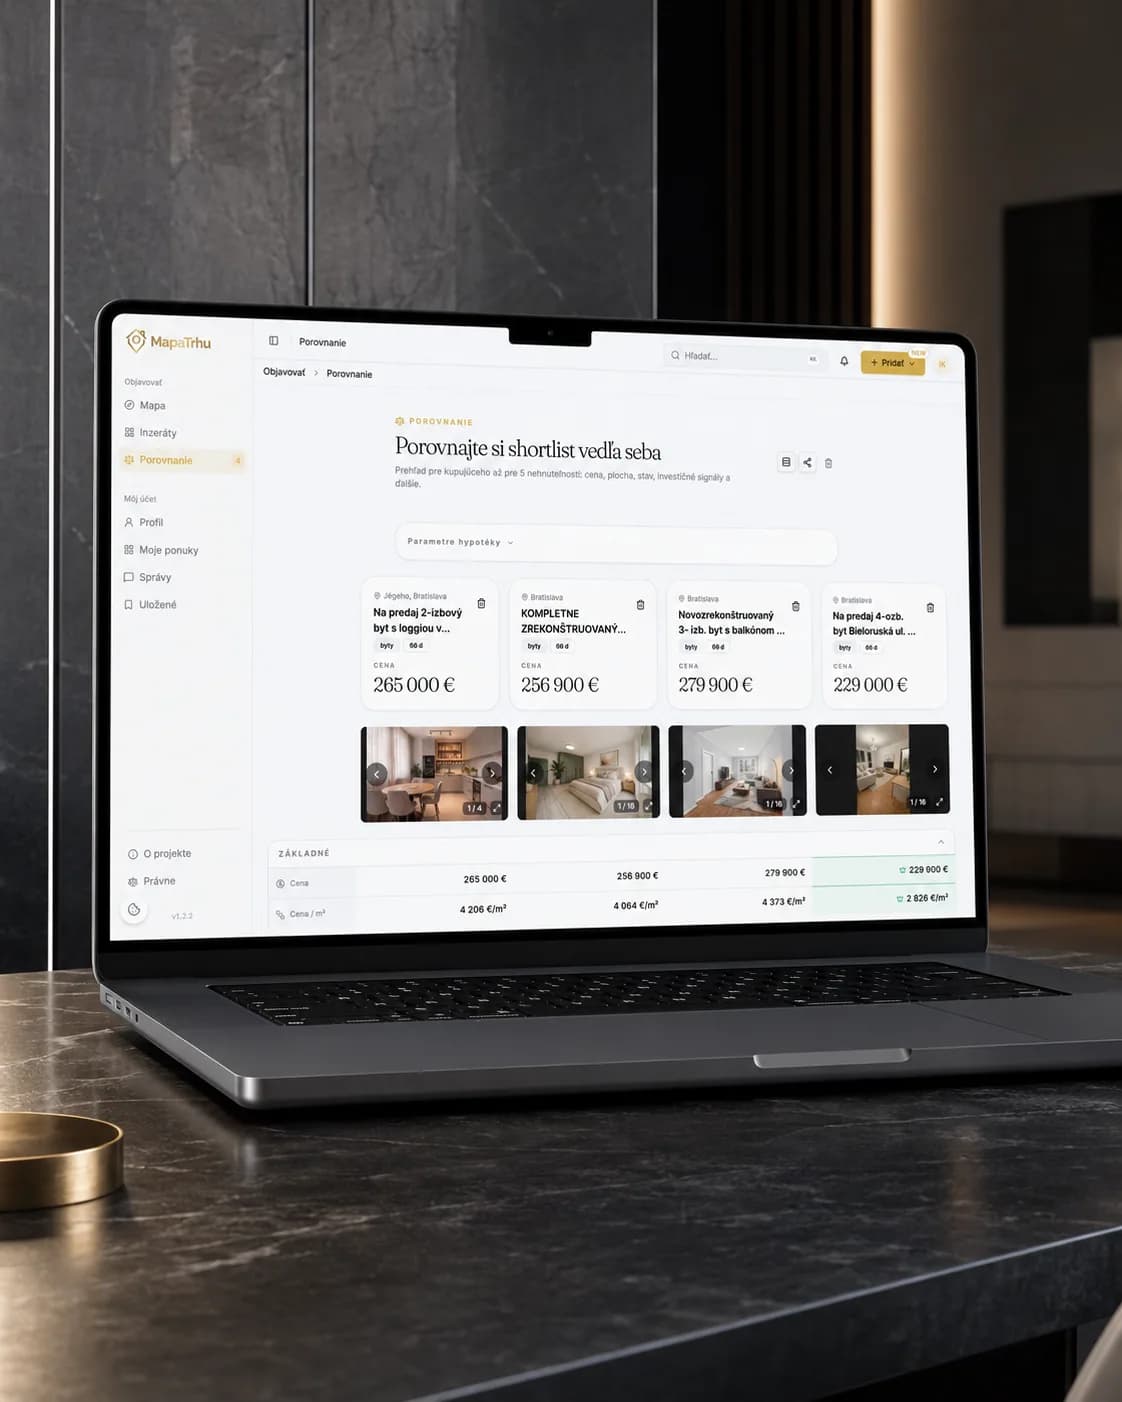
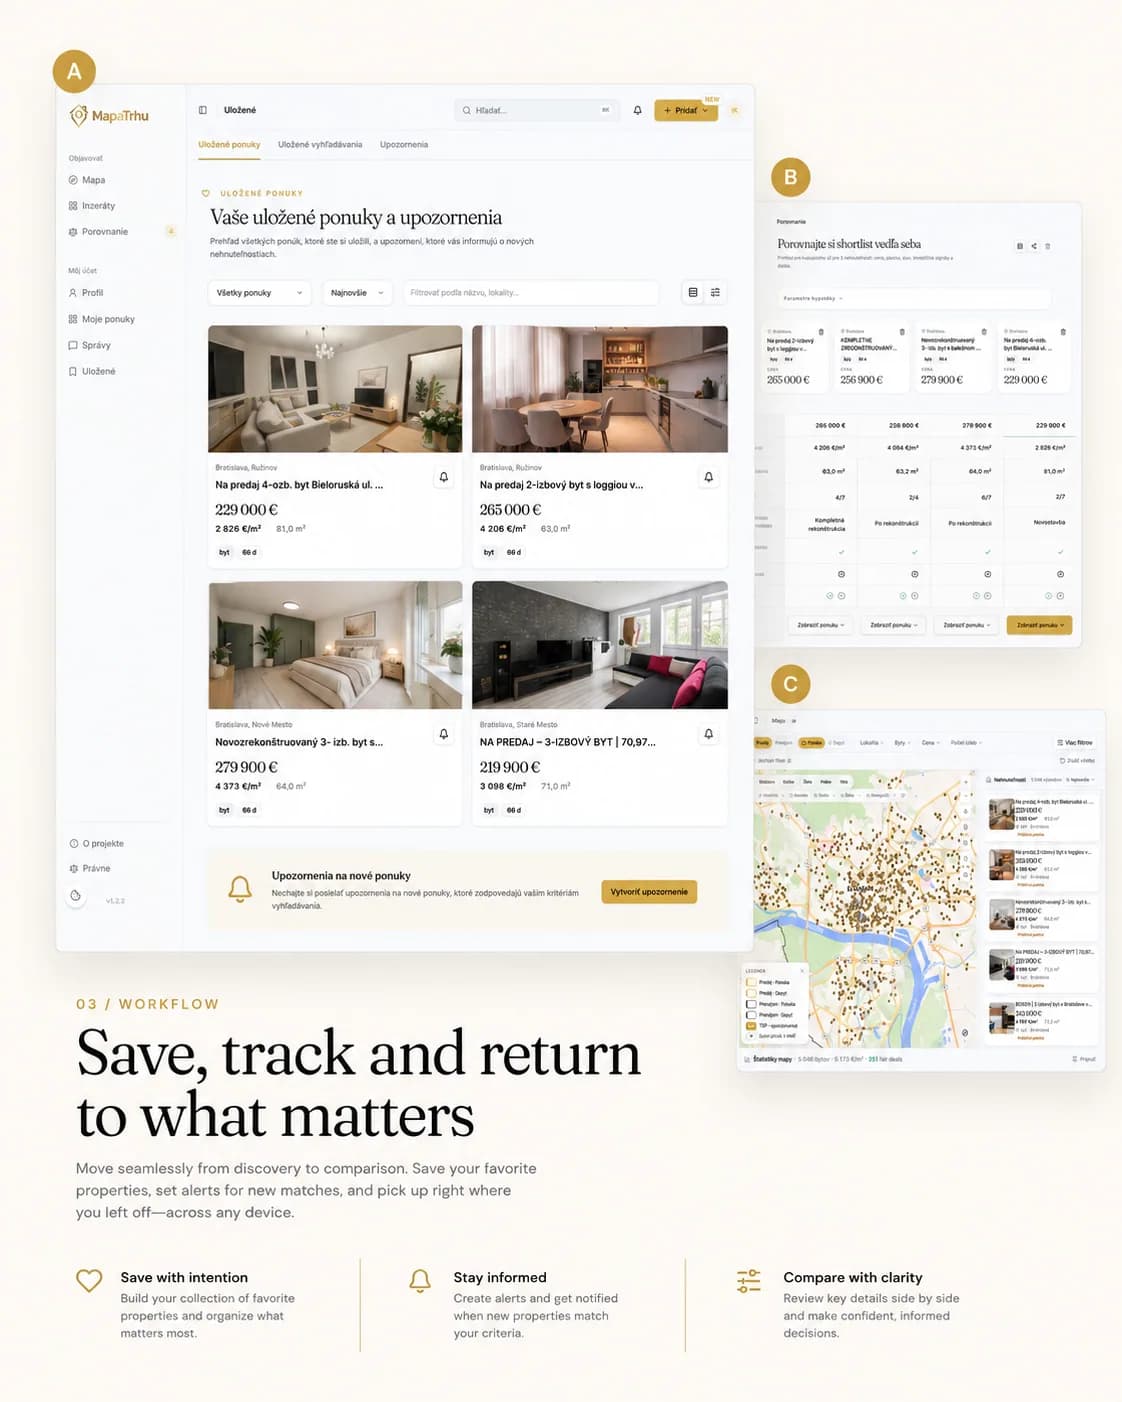
Angebote lassen sich speichern, per Benachrichtigung verfolgen und nebeneinander vergleichen. Einheitliche Angaben für jede Immobilie machen aus einem Gefühl eine überprüfbare Shortlist.

05
Ein lebendes Datenprodukt
Sammlung und Deduplizierung laufen auf PostgreSQL und FastAPI. Die Karte ist MapLibre in React. Rise verantwortet Produkt, Design, Entwicklung und Betrieb, so wachsen Oberfläche und Daten gemeinsam.
Design and engineering
The decision journey shaped the system layers.
A listing keeps its origin, its identity and its price context through every movement of the map. Collection, calculation and public reads sit in separate layers so none of them slows the others down.
Wie wir das System aufgebaut haben
Vom ersten Filter zur engeren Auswahl
Wir haben die Entscheidungen der Käufer und die benötigten Informationen vom ersten Filter bis zur engeren Auswahl erfasst.
Die Quelle jedes Angebots bleibt sichtbar
Wir haben die Datenfelder der Portale verglichen und die Quelle jedes Angebots sowie seiner Änderungen bewahrt.
Dieselbe Immobilie, ein Datensatz
Wir haben ein gemeinsames Angebotsmodell und einen deterministischen Schlüssel entwickelt, der dieselbe Immobilie quellenübergreifend verknüpft.
Eine Aufgabe pro Schicht
Wir trennten Rohdatenerfassung, Identität, Berechnungen und öffentliche Lesezugriffe, damit jede Schicht unabhängig geändert und geprüft werden kann.
Der Kartenausschnitt bestimmt die Abfrage
Wir profilierten Kartenabfragen und ergänzten ein Lesemodell, Cache und geplante Aufgaben rund um den tatsächlichen Kartenausschnitt.
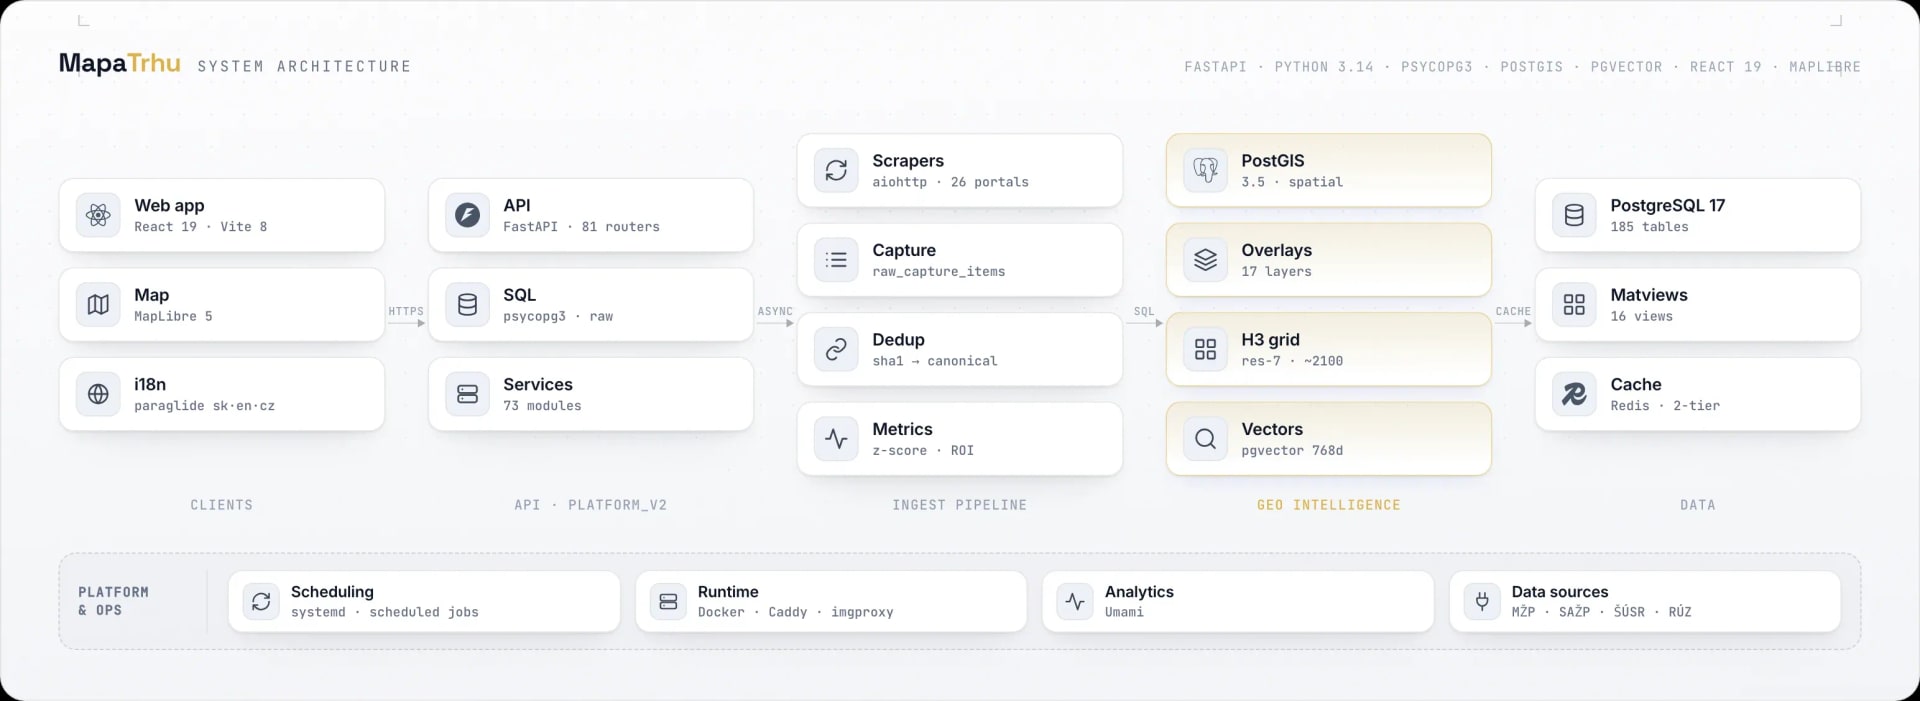
Scroll the diagram horizontally.
- 01
Client and map
React 19, TypeScript 6, Vite 8, MapLibre 5, TanStack Query, and Zustand keep filters, viewport, detail, and comparison in one state.
- 02
API and services
FastAPI in platform_v2 registers 81 route modules. Seventy-three services and raw psycopg3 separate domain decisions from SQL reads.
- 03
Ingestion and identity
aiohttp collectors read about 26 portals over HTTP, preserve the raw record, and deterministically link the same listings without losing provenance.
- 04
Geo intelligence
PostGIS 3.5 serves spatial selections, 17 layers, and an H3 resolution-7 grid. pgvector adds text retrieval and similarity.
- 05
Data and operations
PostgreSQL 17, Redis 8, materialized views, systemd jobs, Docker, Caddy, and imgproxy support fast reads and regular data refresh.
Listing data pipeline
Every listing passes through five controlled stages.
Raw portal data never reaches the map. A record keeps its source, gets normalized, is linked to the property it duplicates and picks up calculated signals. Only then does it enter the read model.
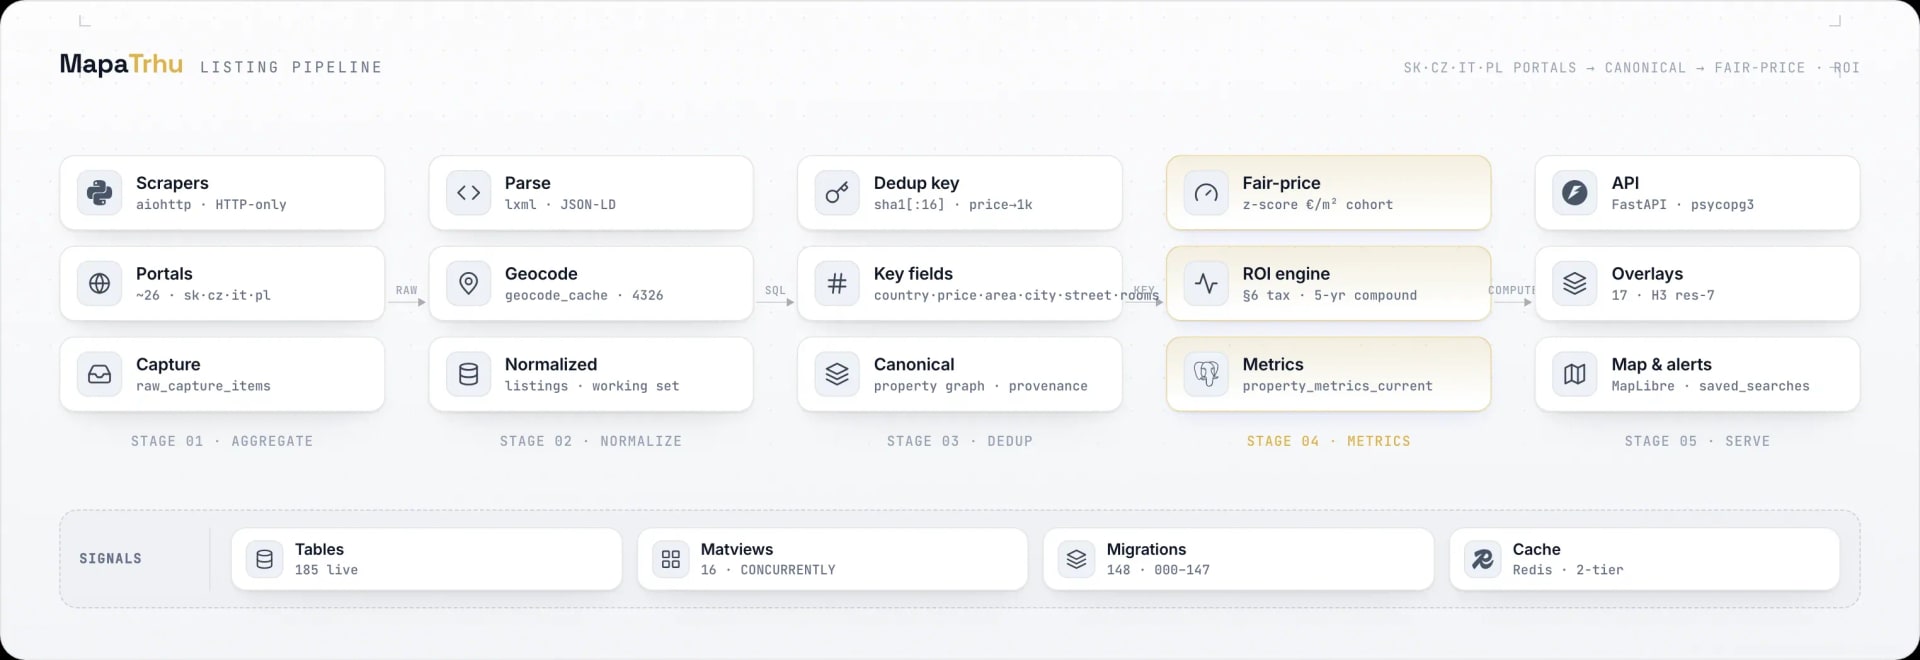
Scroll the diagram horizontally.
- 01
Capture the source
HTTP collectors for about 26 portals store the raw response and keep downloading separate from later processing.
- 02
Normalize
Parsing and geocoding turn different names, prices, areas, addresses, and coordinates into the shared listings working model.
- 03
Link identity
A SHA-1 key built from country, rounded price and area, city, street, and rooms links sources while preserving their history.
- 04
Calculate signals
A cohort price-per-square-metre z-score and ROI methodology populate property_metrics_current. The output remains an estimate with an explained source.
- 05
Serve the map
FastAPI, read models, and two-tier caching serve the MapLibre map, 17 layers, details, alerts, and saved searches.