MapaTrhu · Data product
Context first. Then decide.
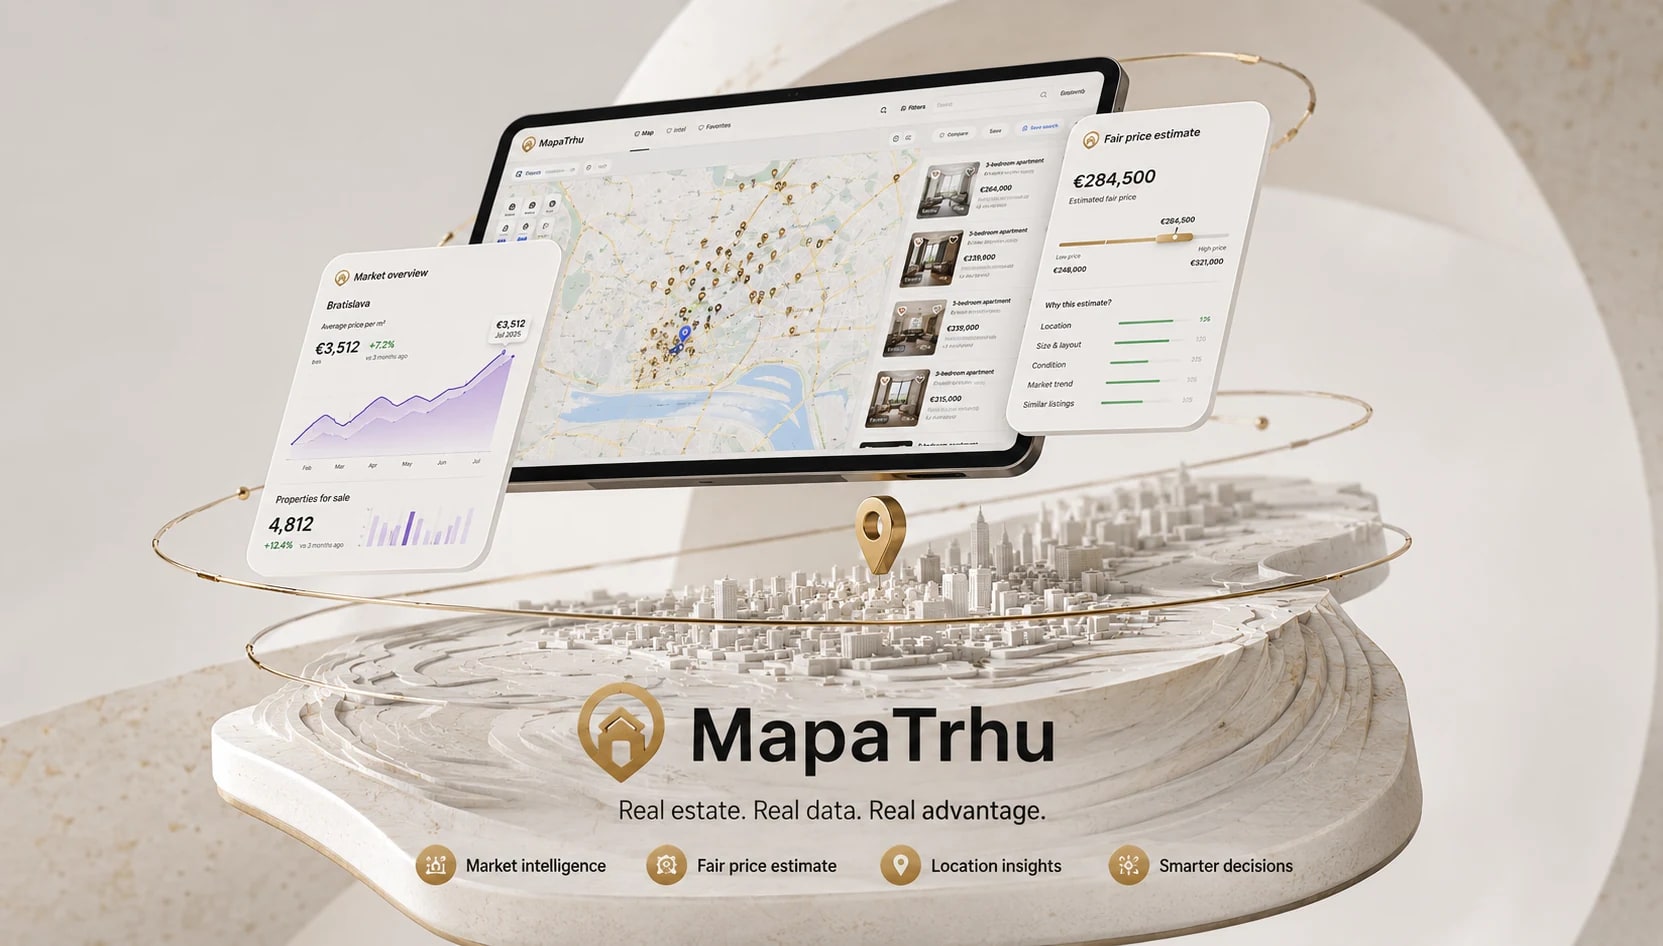
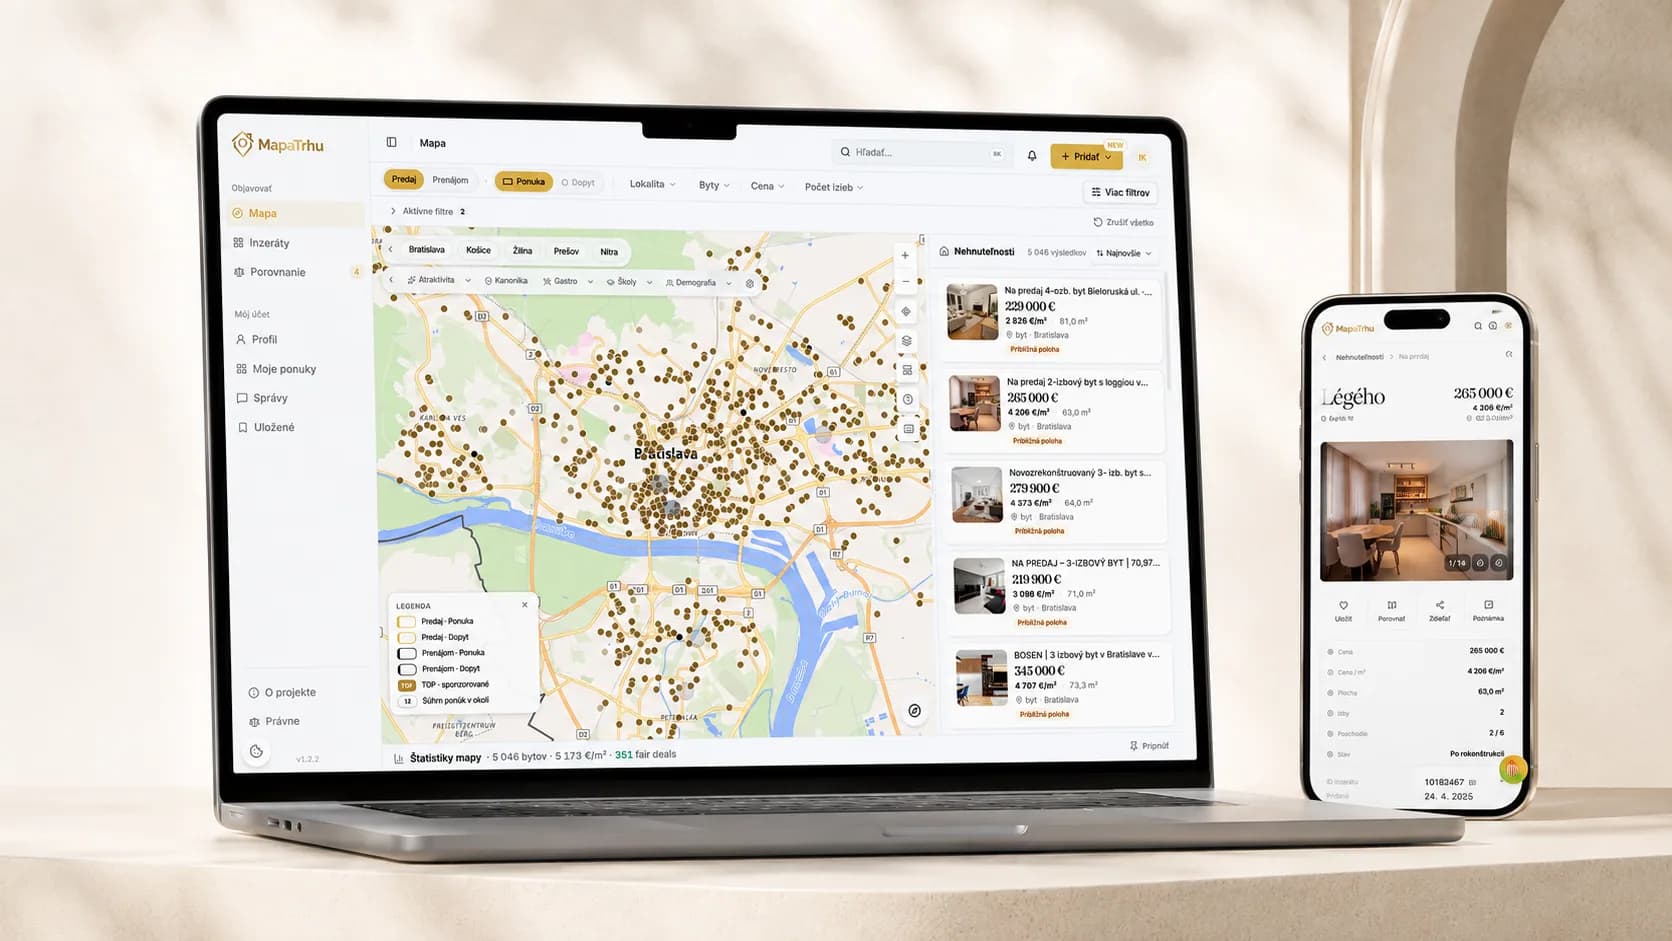
MapaTrhu brings listings from multiple portals, price development, location context, and comparison into one workspace for buying property.

Decision journey
Five steps from the map to fair-price context.
The selected market stays put when a user opens a listing from the map. Price, locality and comparable offers load progressively, each one arriving at the moment it can inform the next decision.
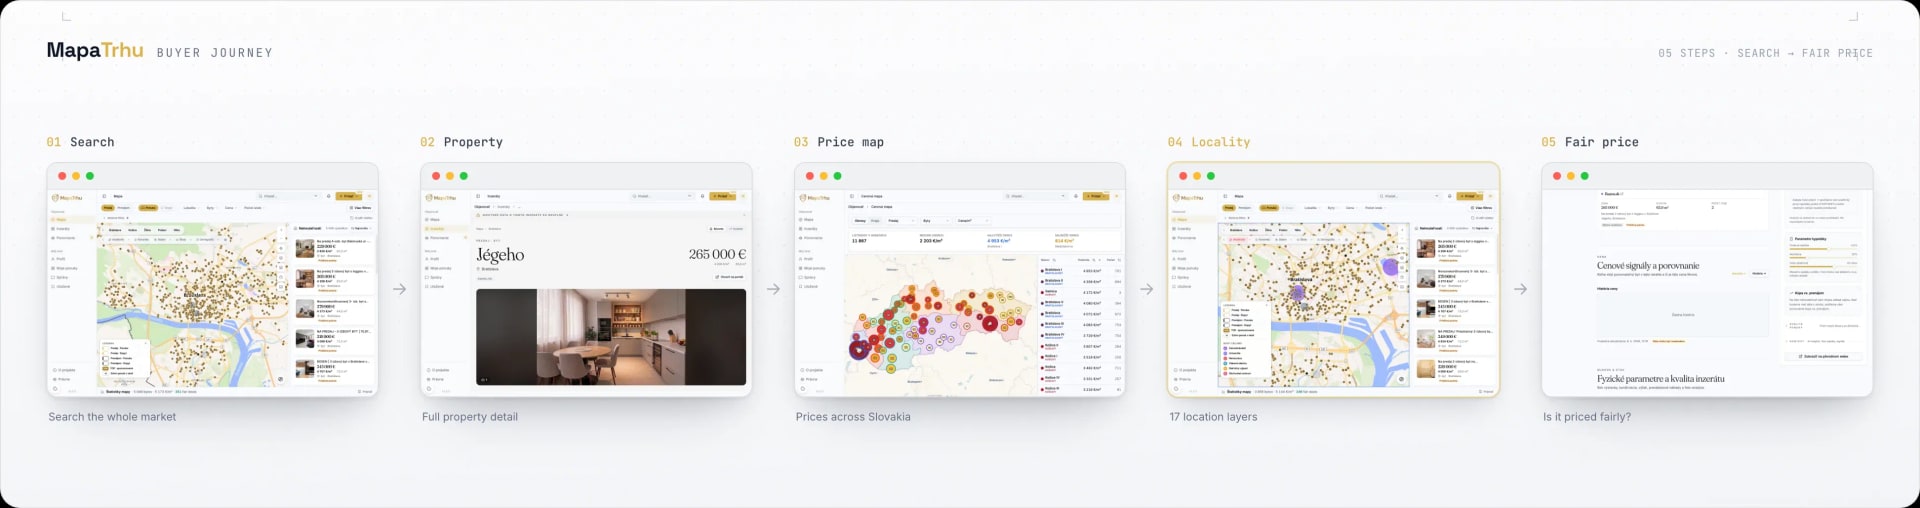
Scroll the diagram horizontally.
- 01
Search the market
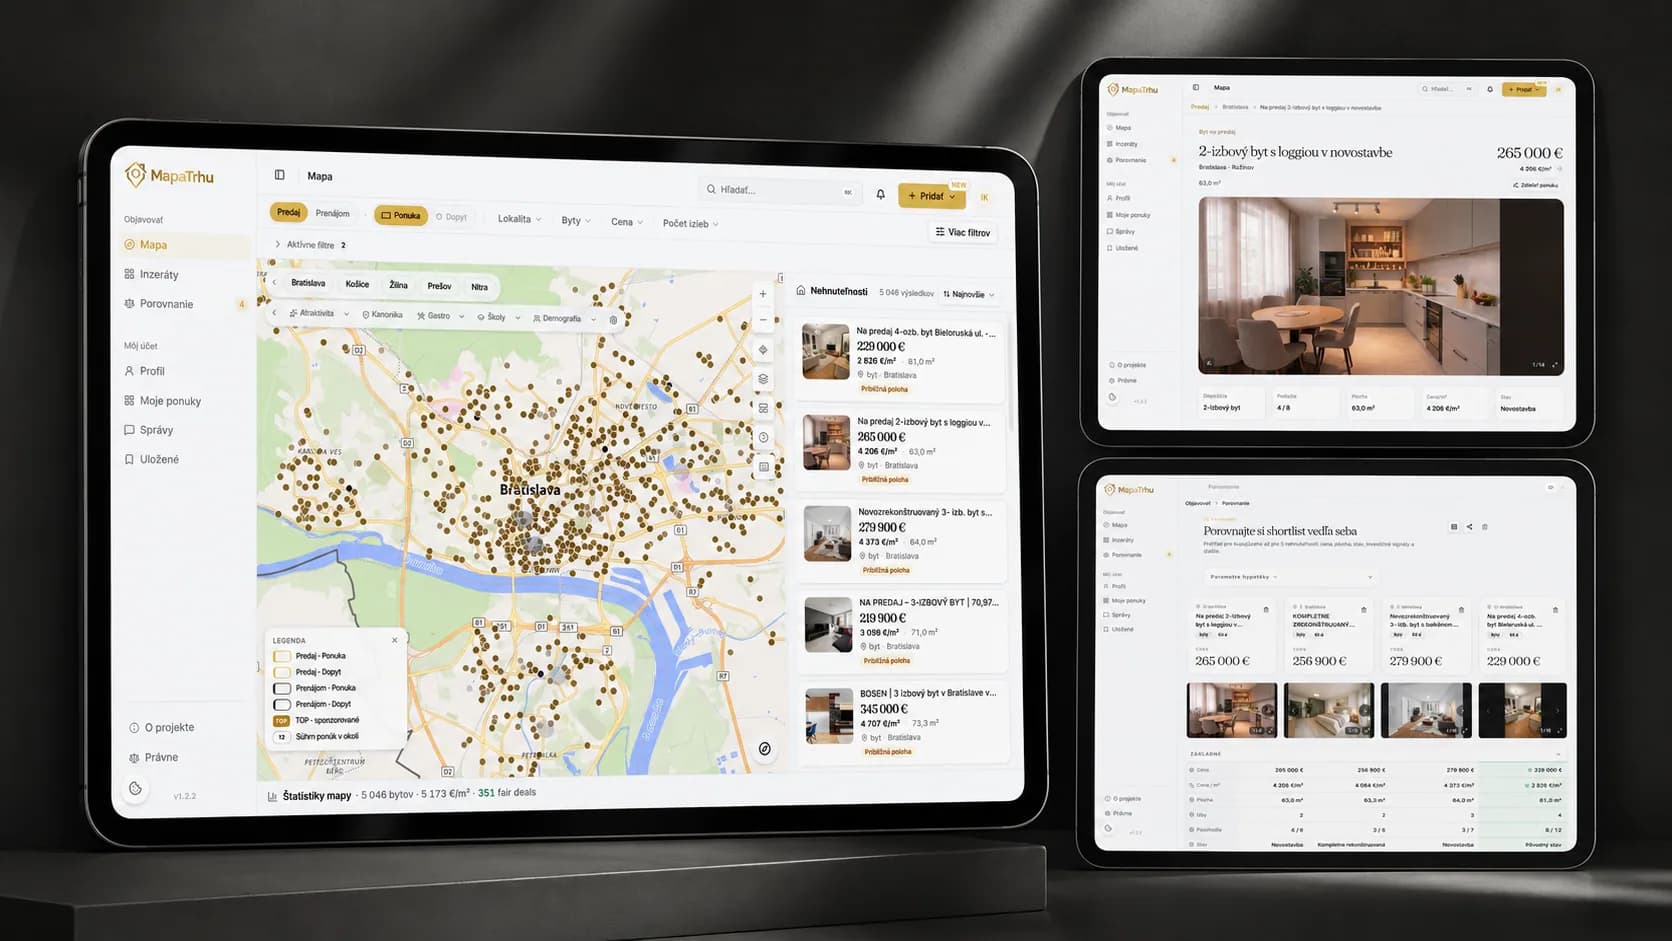
Listings from multiple portals share one map. Viewport and filters update the results together, keeping the visible market relevant.
- 02
Open the property
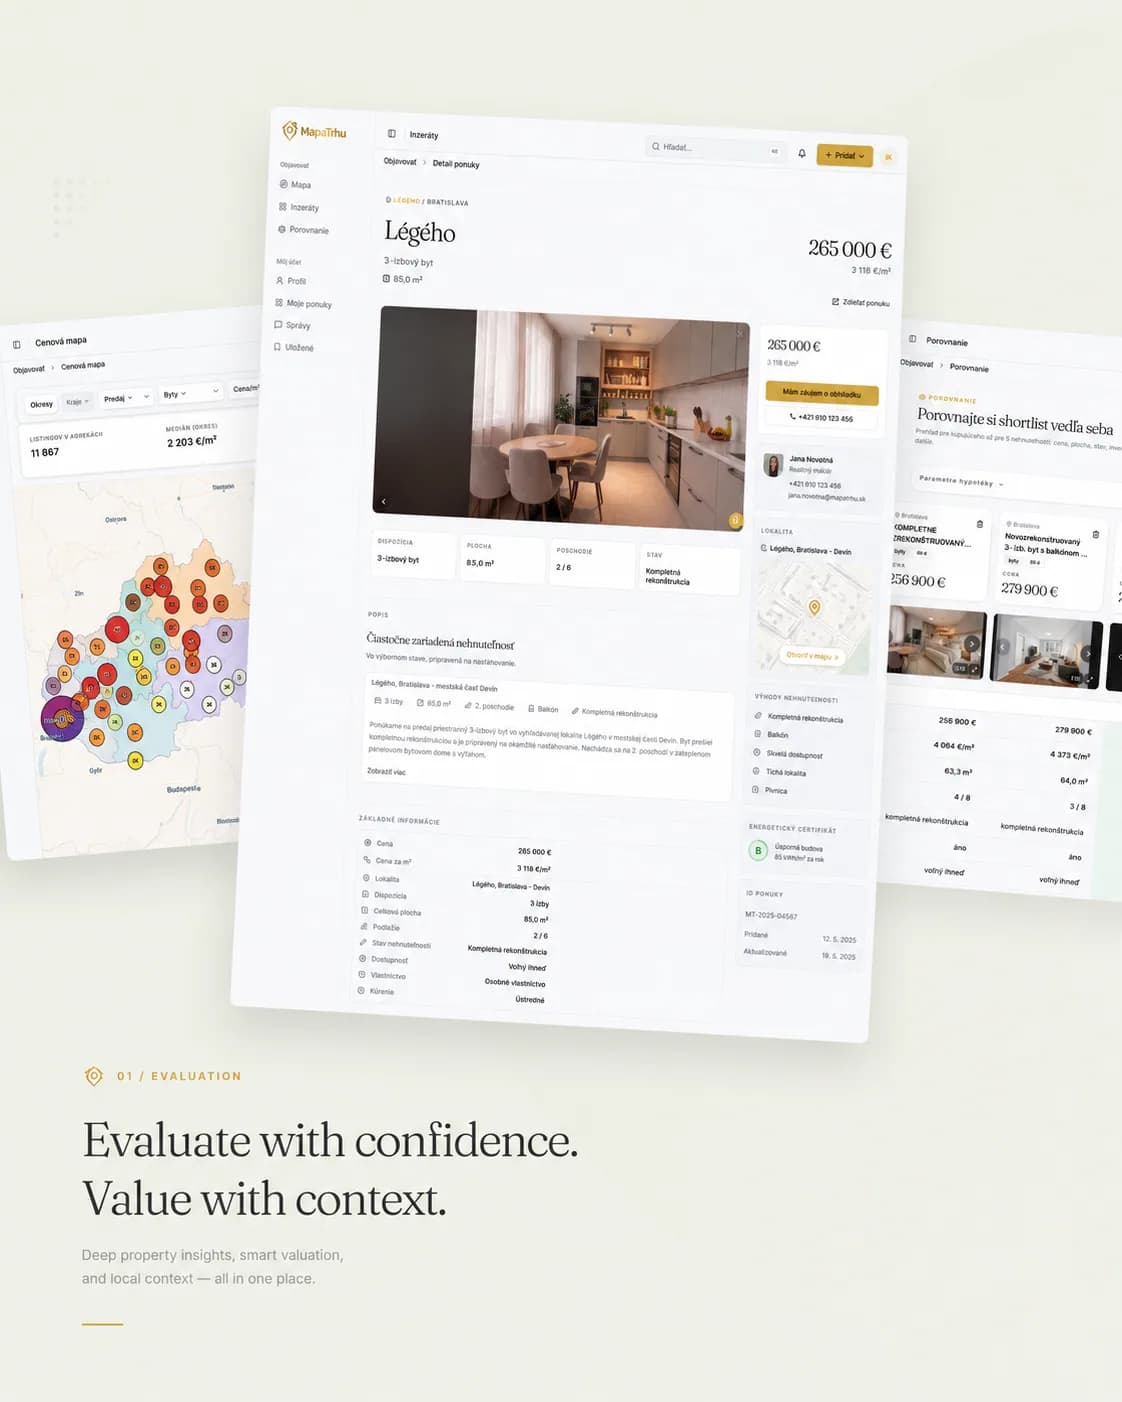
The detail keeps the selected area in context and adds source, price, history, attributes, and photos without returning to a stack of portal tabs.
- 03
Read the price map
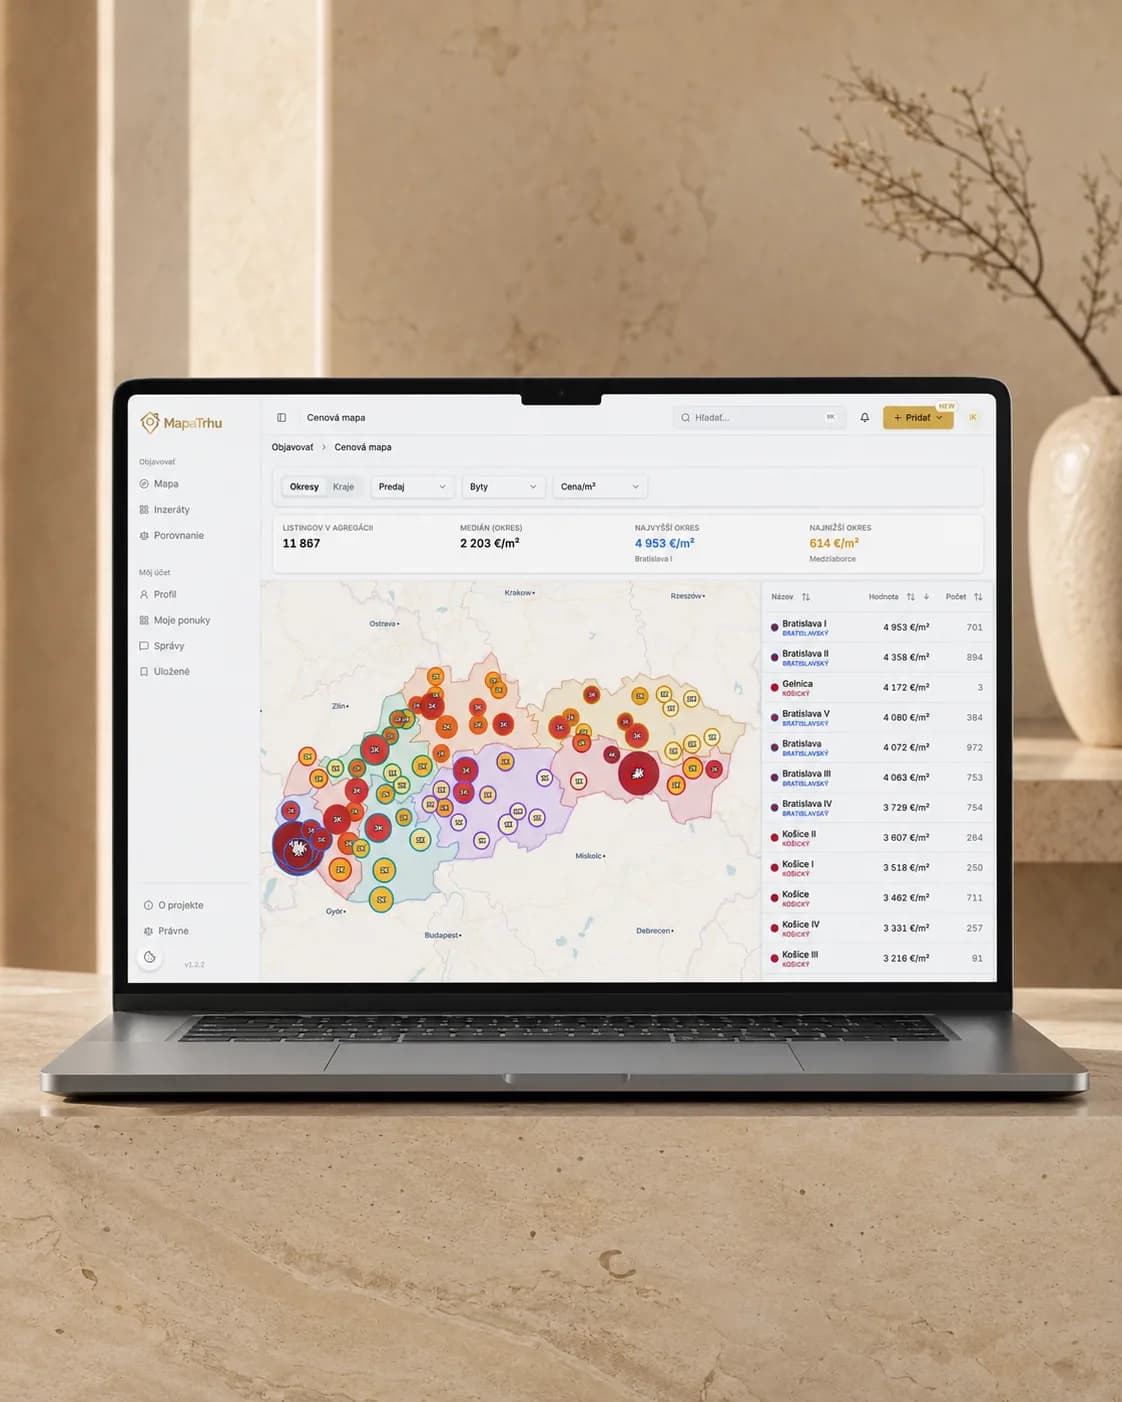
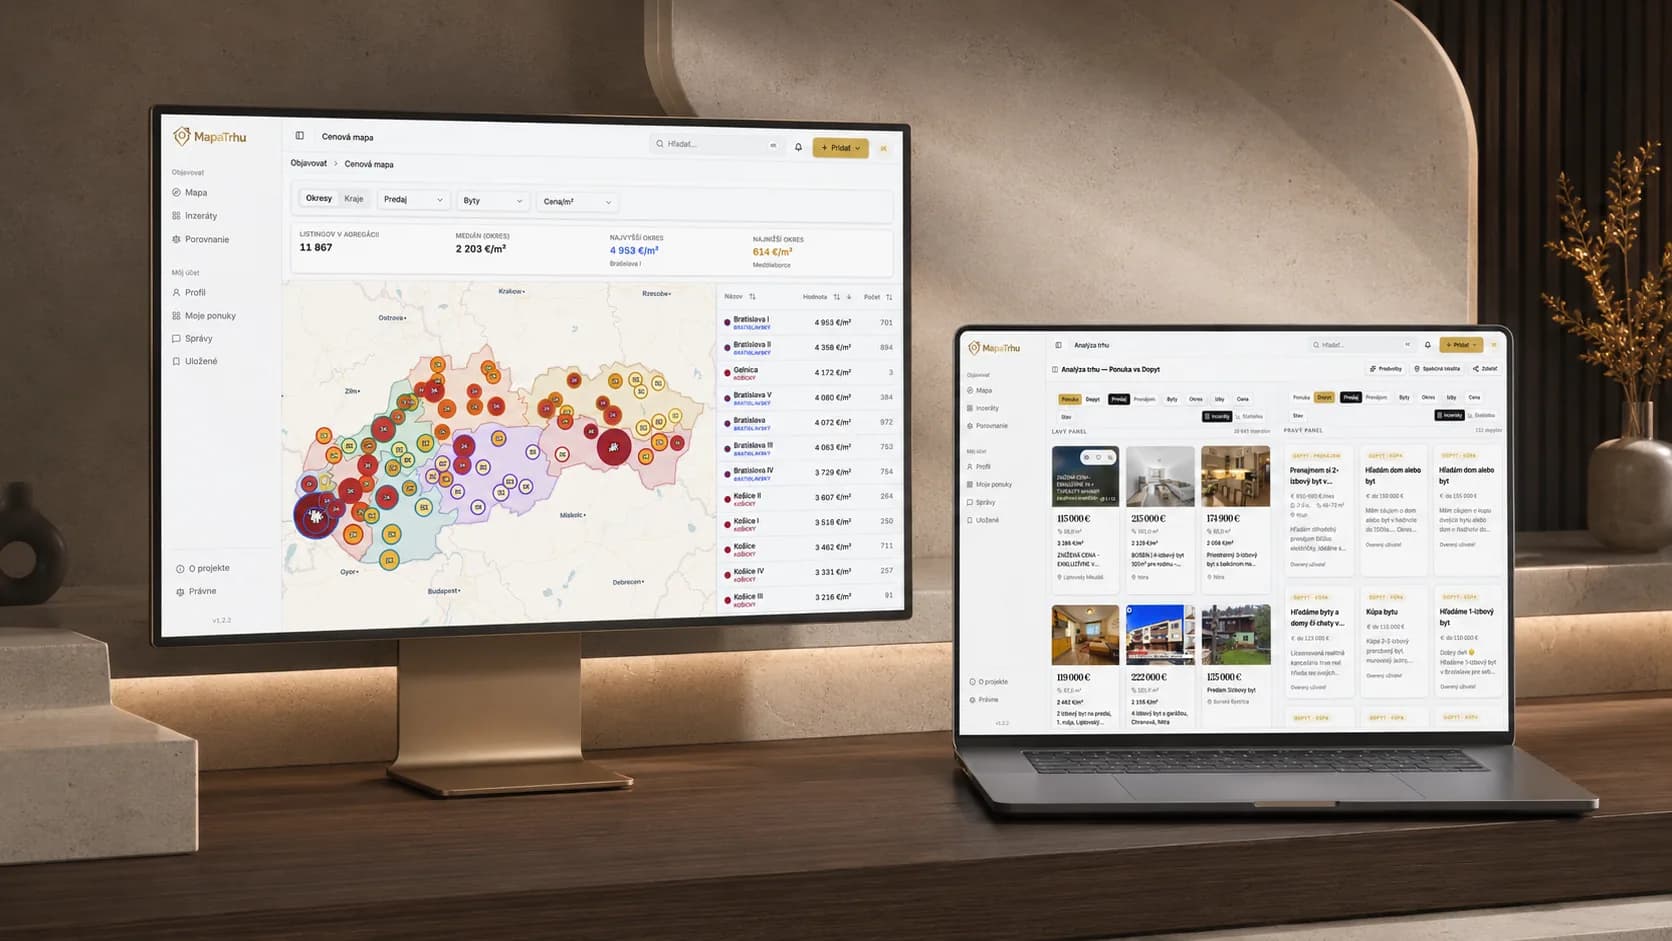
The price map compares districts and localities through a consistent price-per-square-metre view, giving one asking price a market frame.
- 04
Understand the locality
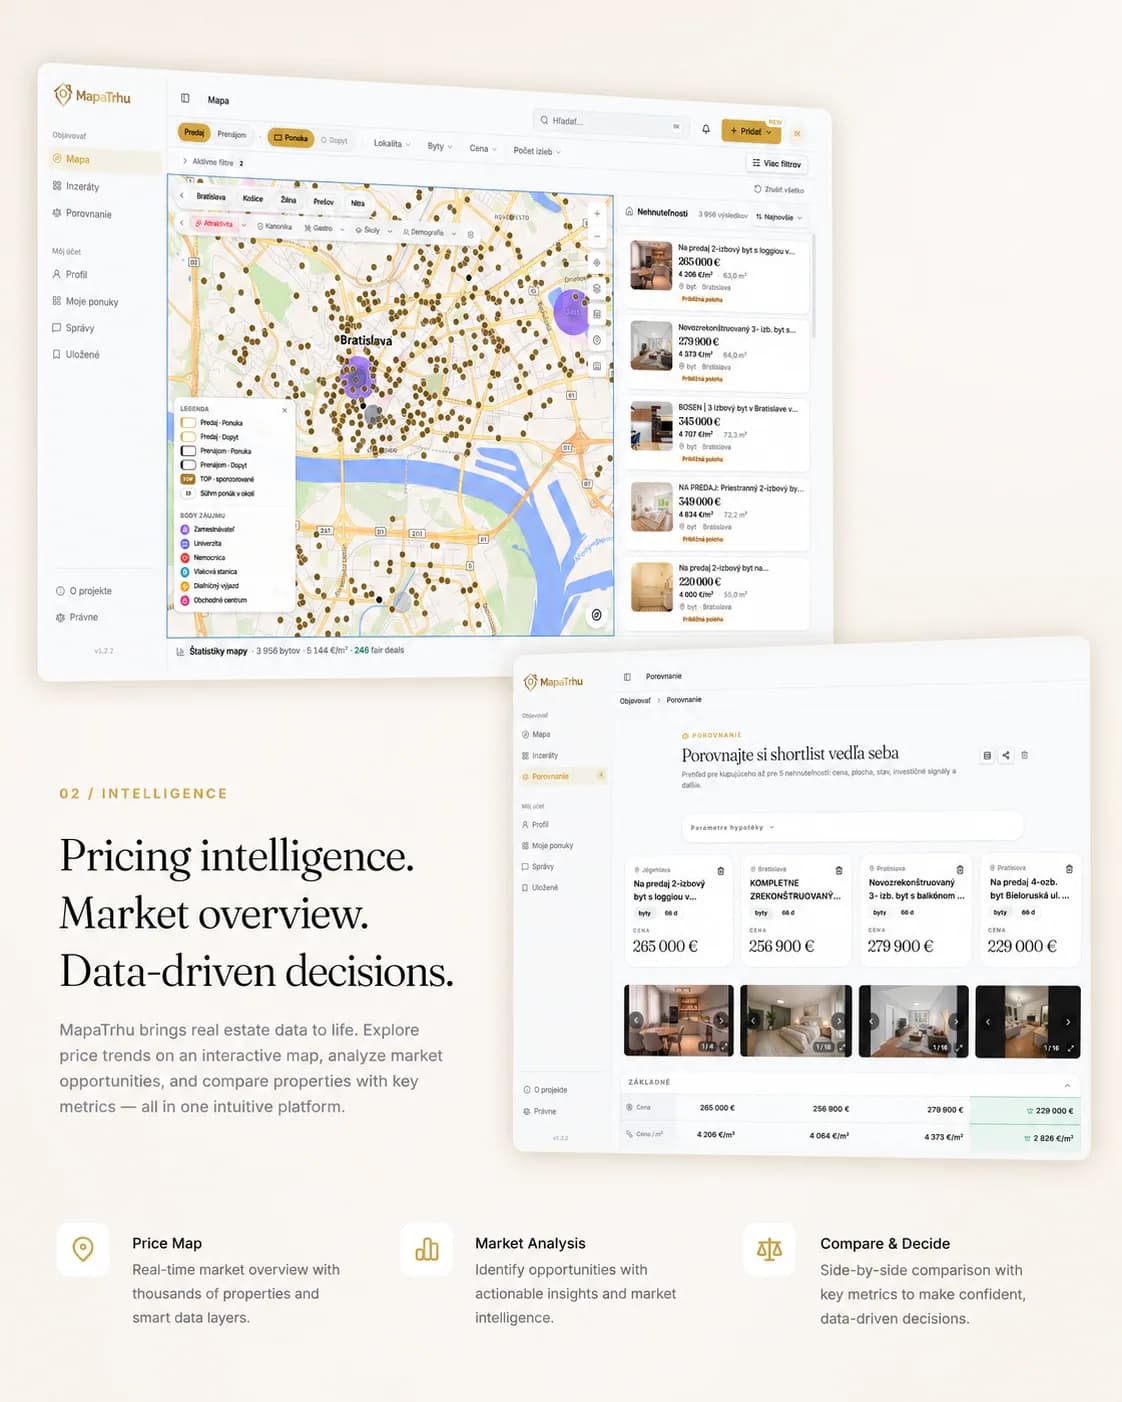
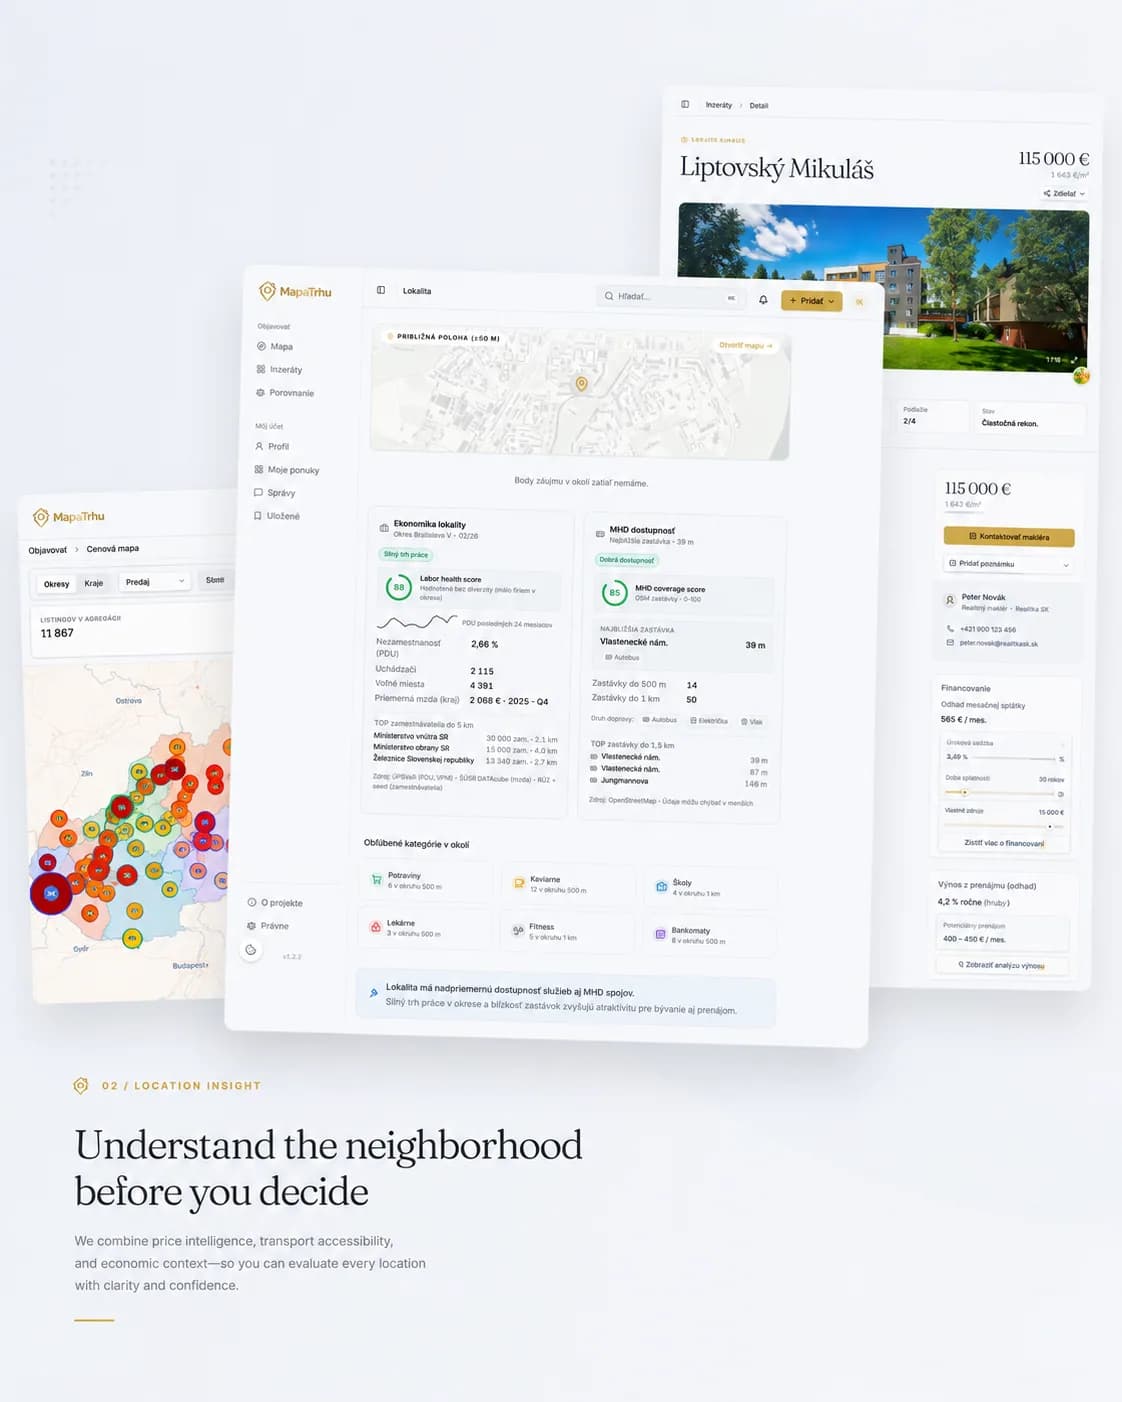
Seventeen optional layers add transport, parks, schools, demography, risks, services, and analytical signals directly to the map.
- 05
Check fair-price context
The estimate uses comparable price per square metre, time weighting, and data availability. It communicates context and confidence, not a guaranteed value.
Information
- Project type
- Owned property data product
- Platform
- Public web application
- Our role
- We built the product from scratch and still run it, from listing collection to the map interface.
- Status
- Live and free at mapatrhu.sk
Technology
- React 19
- TypeScript 6
- Vite 8
- MapLibre 5
- TanStack Query
- Zustand
- Tailwind CSS 4
- Paraglide
- FastAPI
- Python 3.14
- PostgreSQL 17
- PostGIS 3.5
- pgvector
- psycopg3
- Redis 8
- aiohttp
- Docker
- Caddy
What you will learn
- 01How to connect listings from several portals without losing their history.
- 02How to keep the map readable and fast as data volume grows.
- 03How price, location, and comparison reduce uncertainty when buying.

01
A fragmented market
One property can appear on several portals with different copy and no continuous history. Buyers are left assembling a view of the market from open tabs, spreadsheets, and impressions.
“A home-buying decision needs more than a photo and an asking price.”

02
The map as a workspace
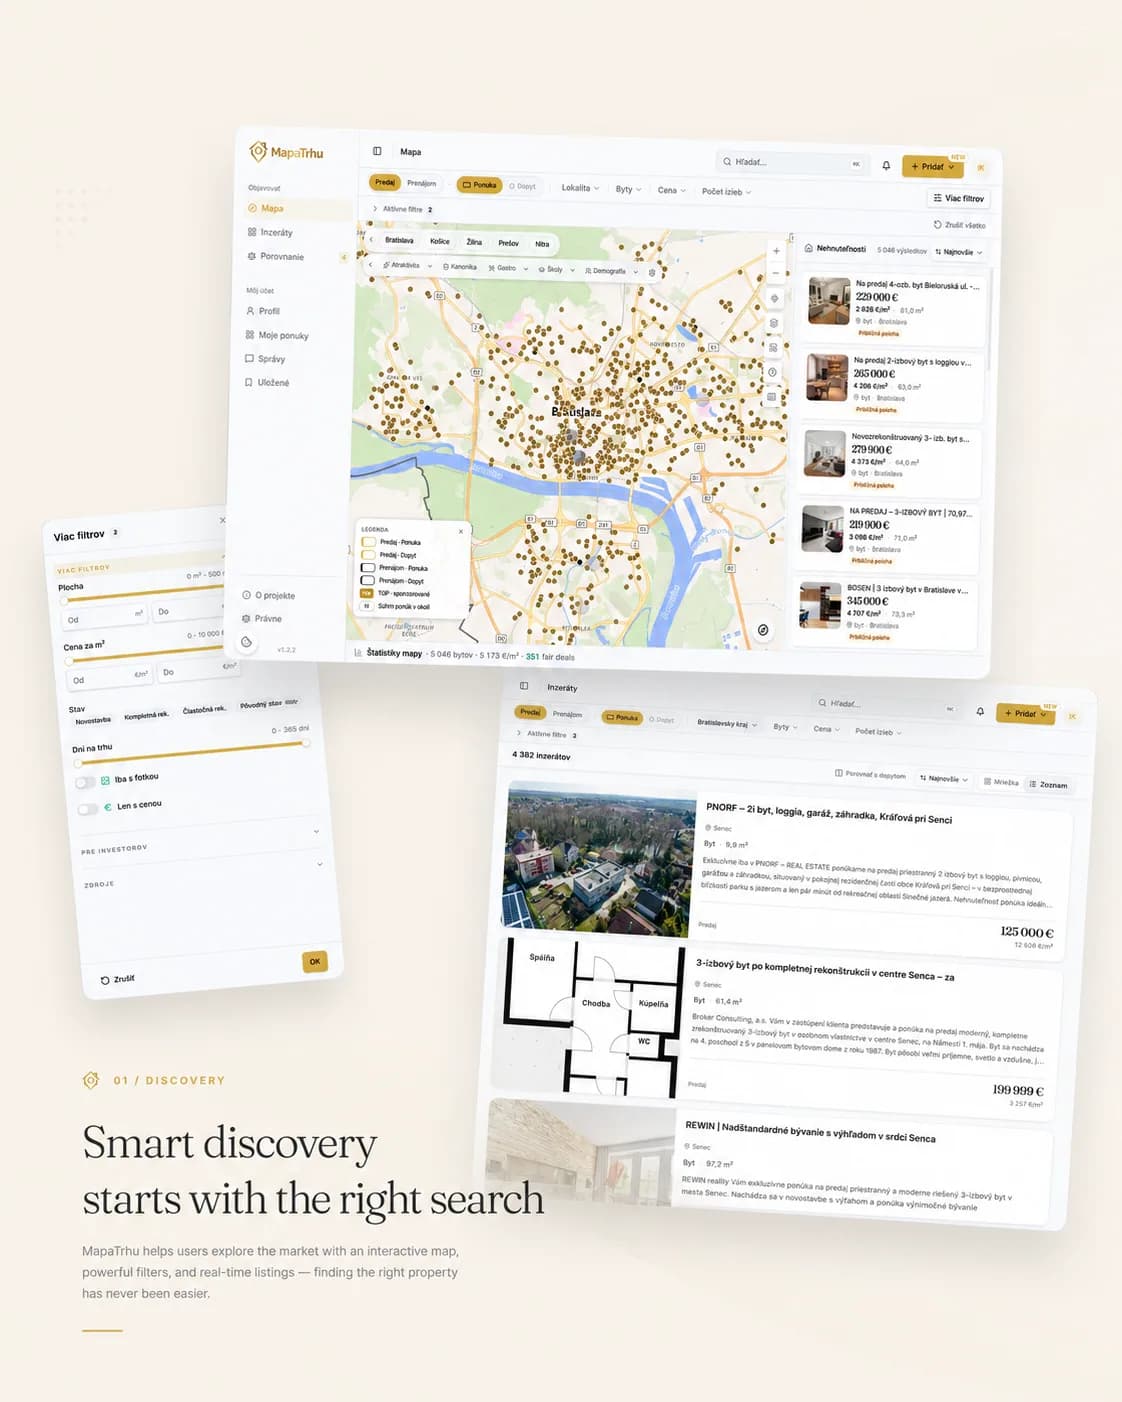
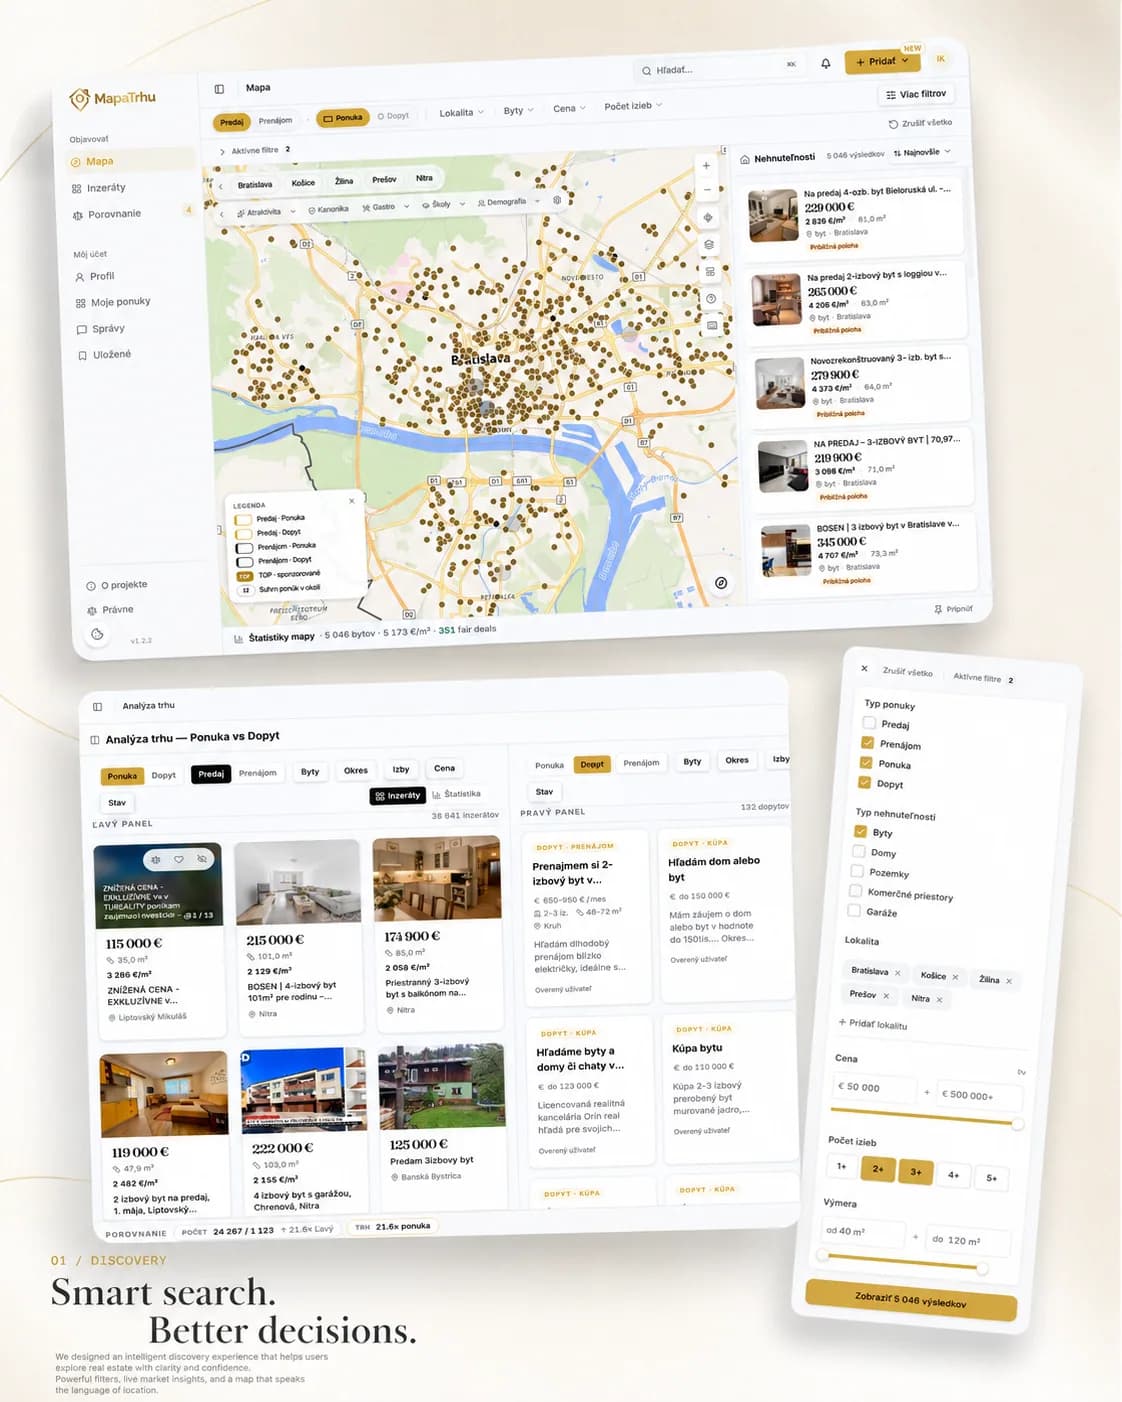
The map is the main workspace. As users move and filter, points, results, and location layers change together so the link between a listing and its place remains clear.
03
Price needs context
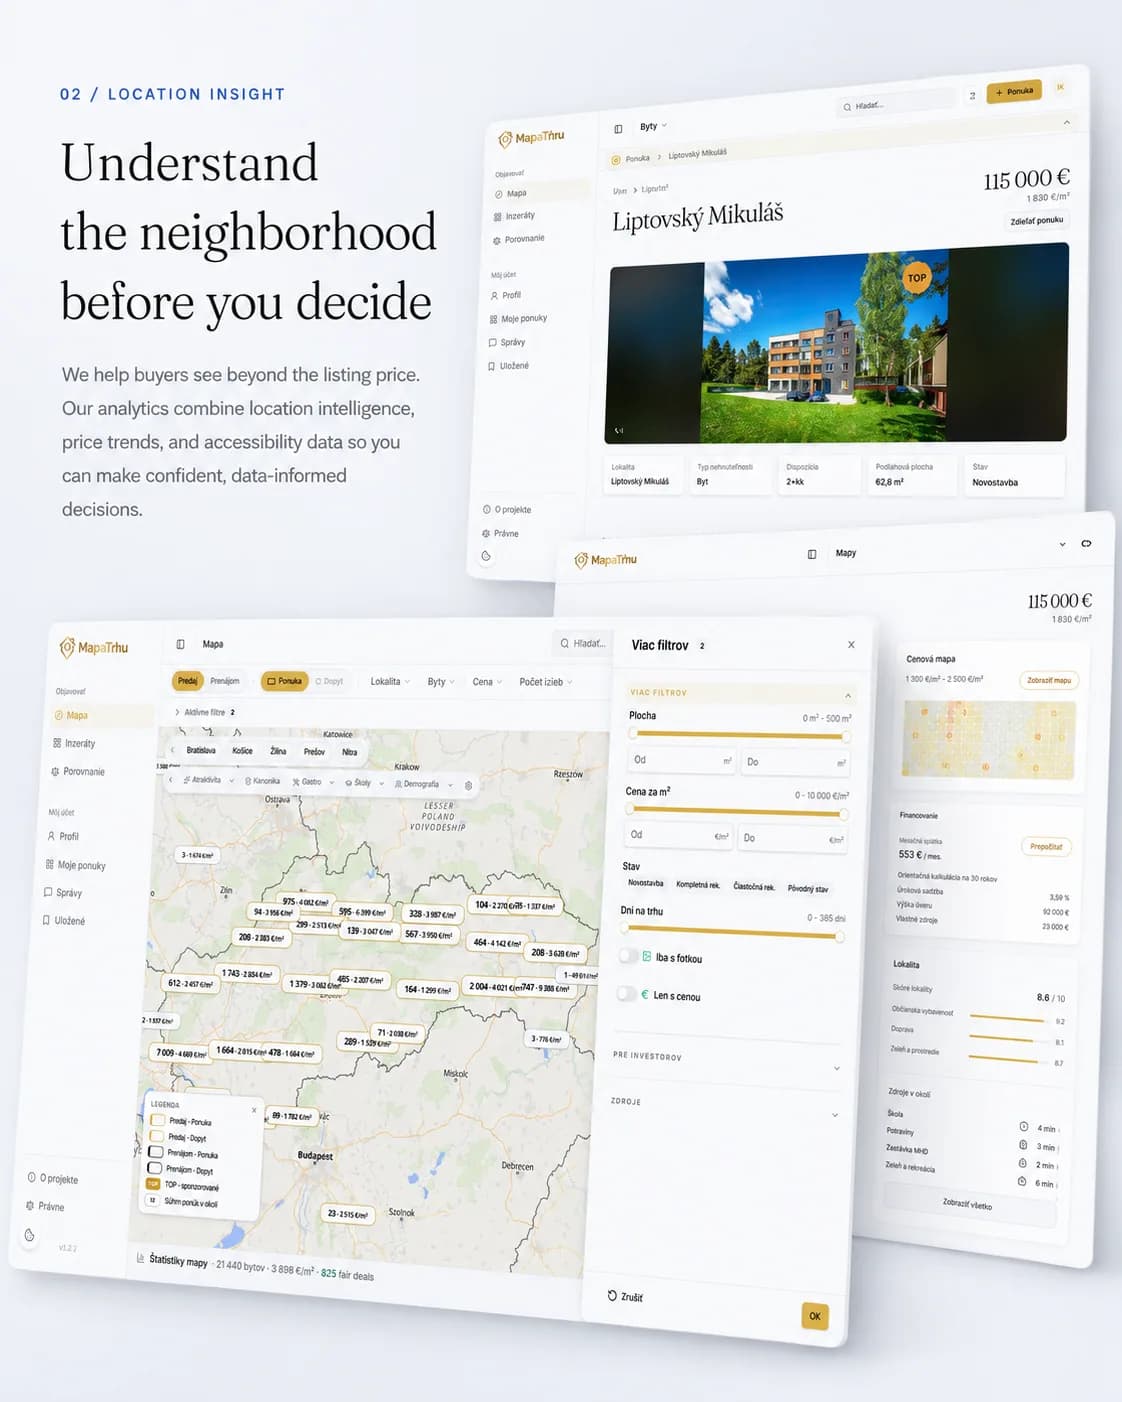
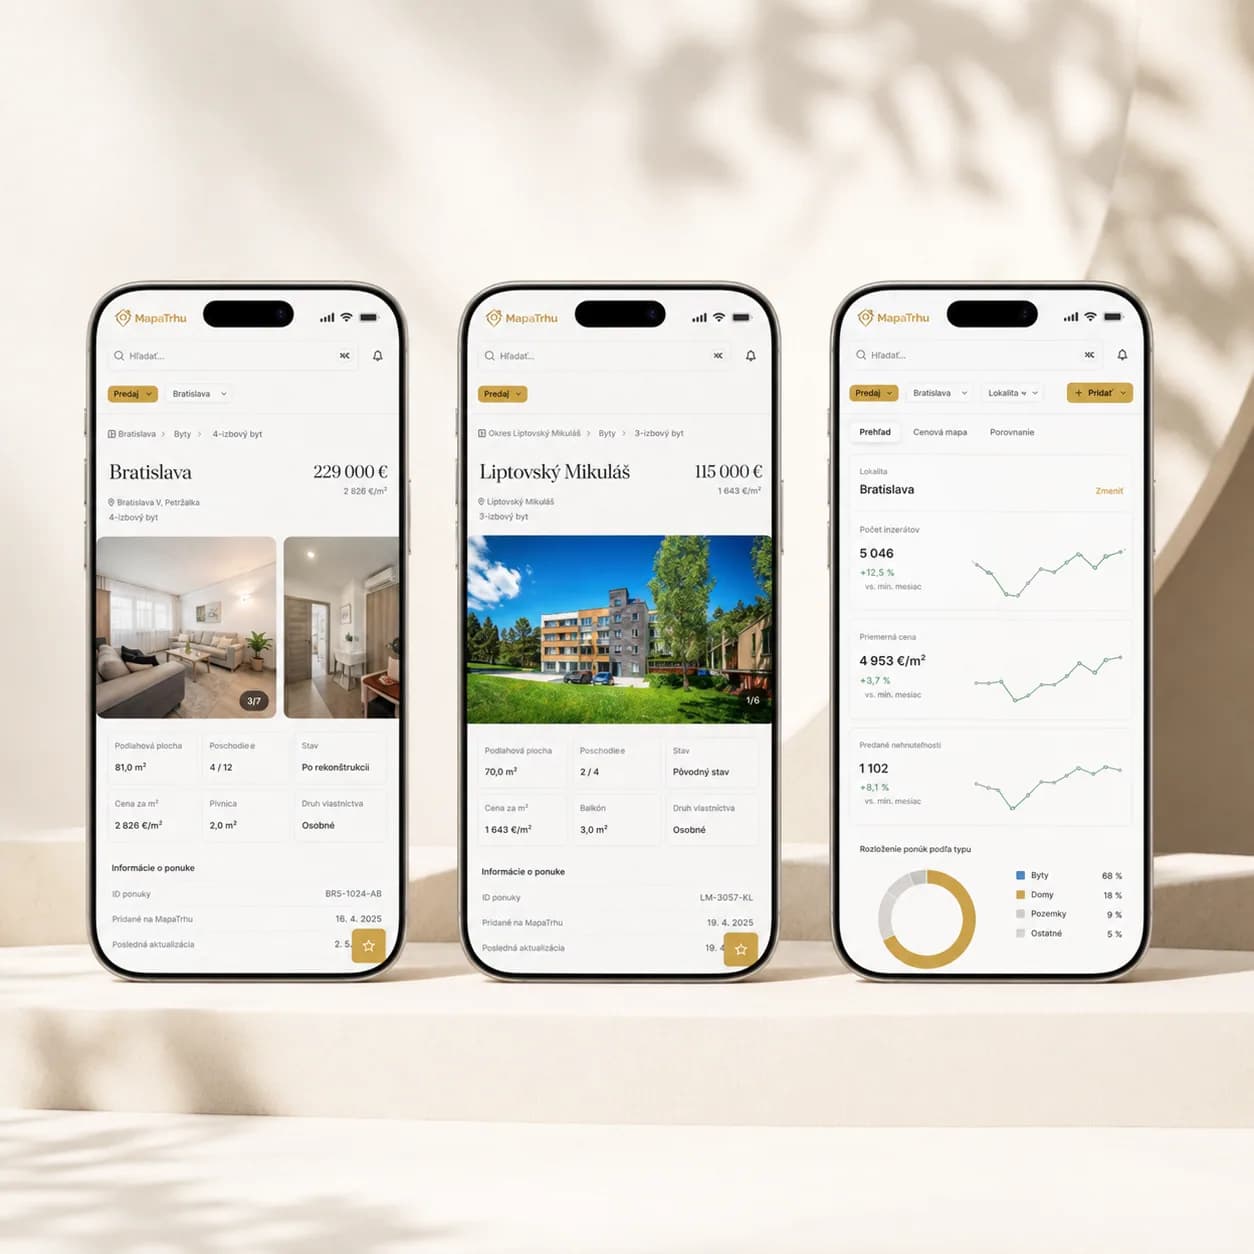
The price map compares districts and locations. Open a listing and you also get price history, access and what is nearby. No estimate is a certainty, so every number carries its source and confidence.
04
A shortlist built for comparison
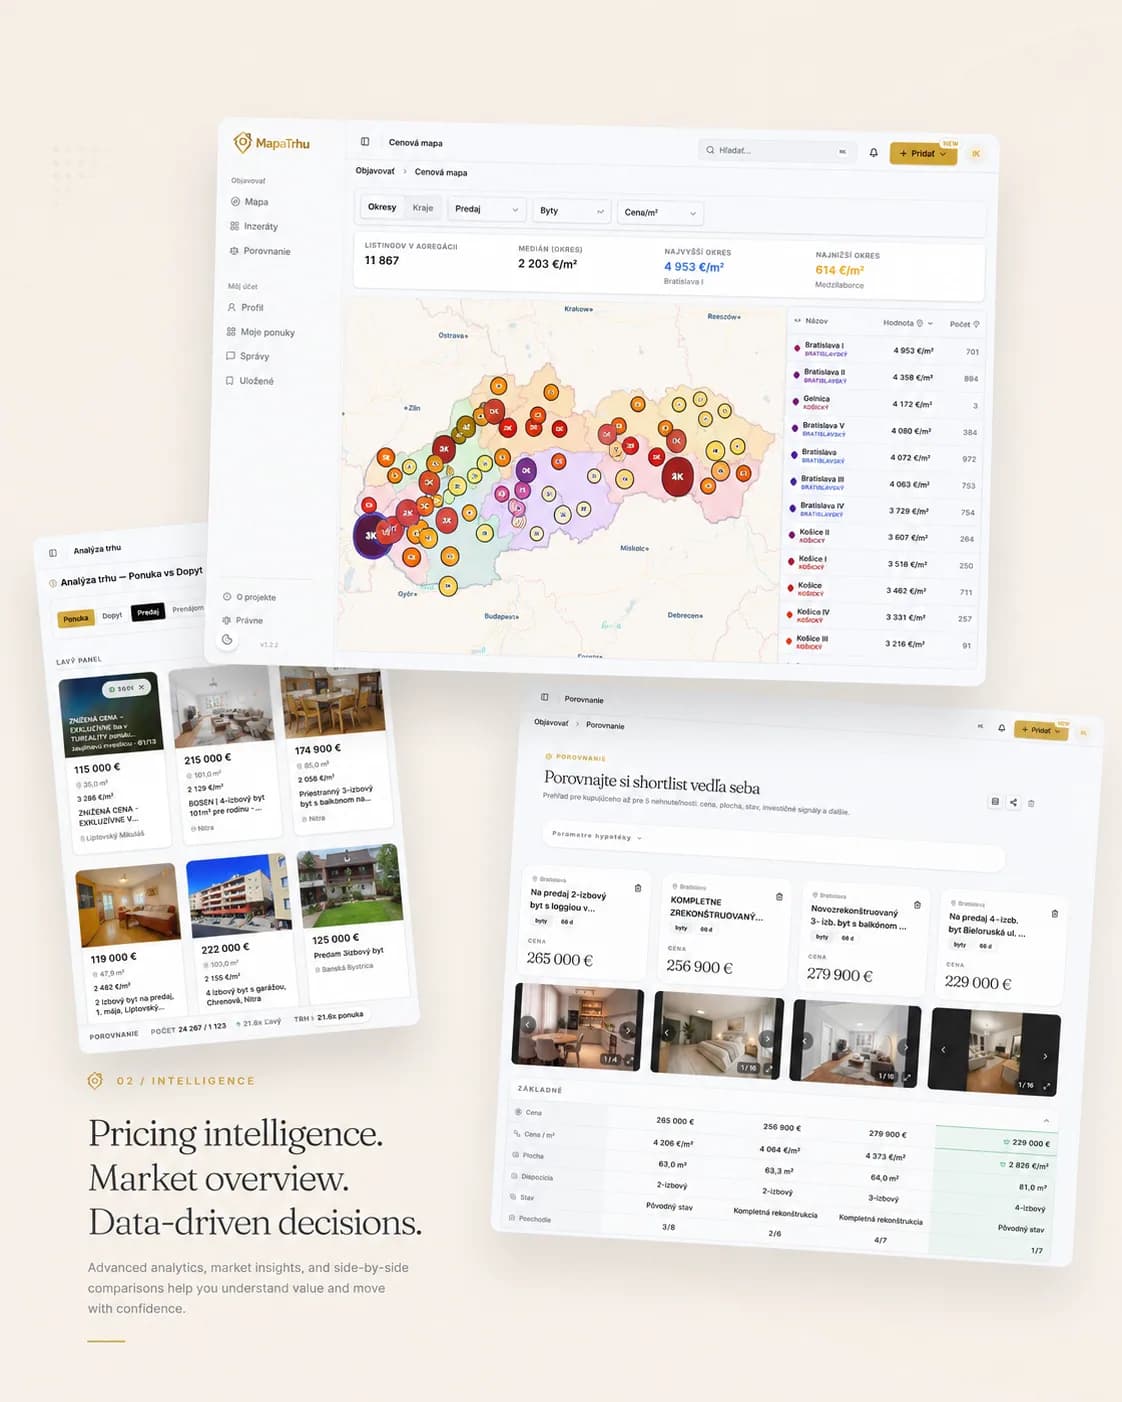
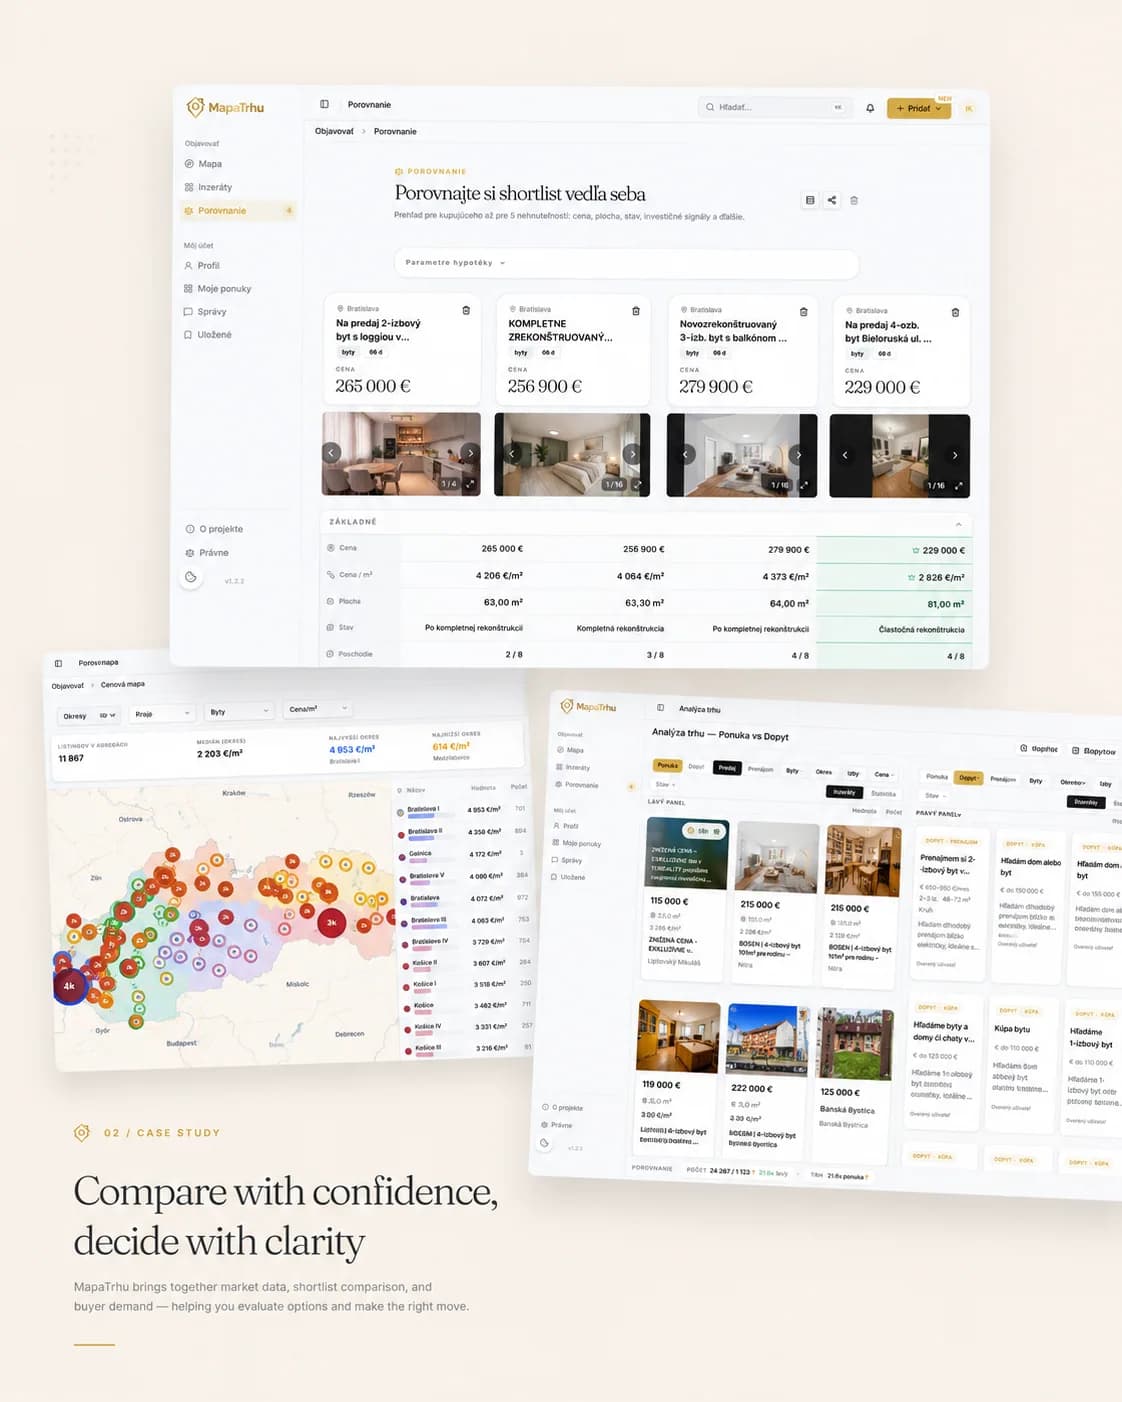
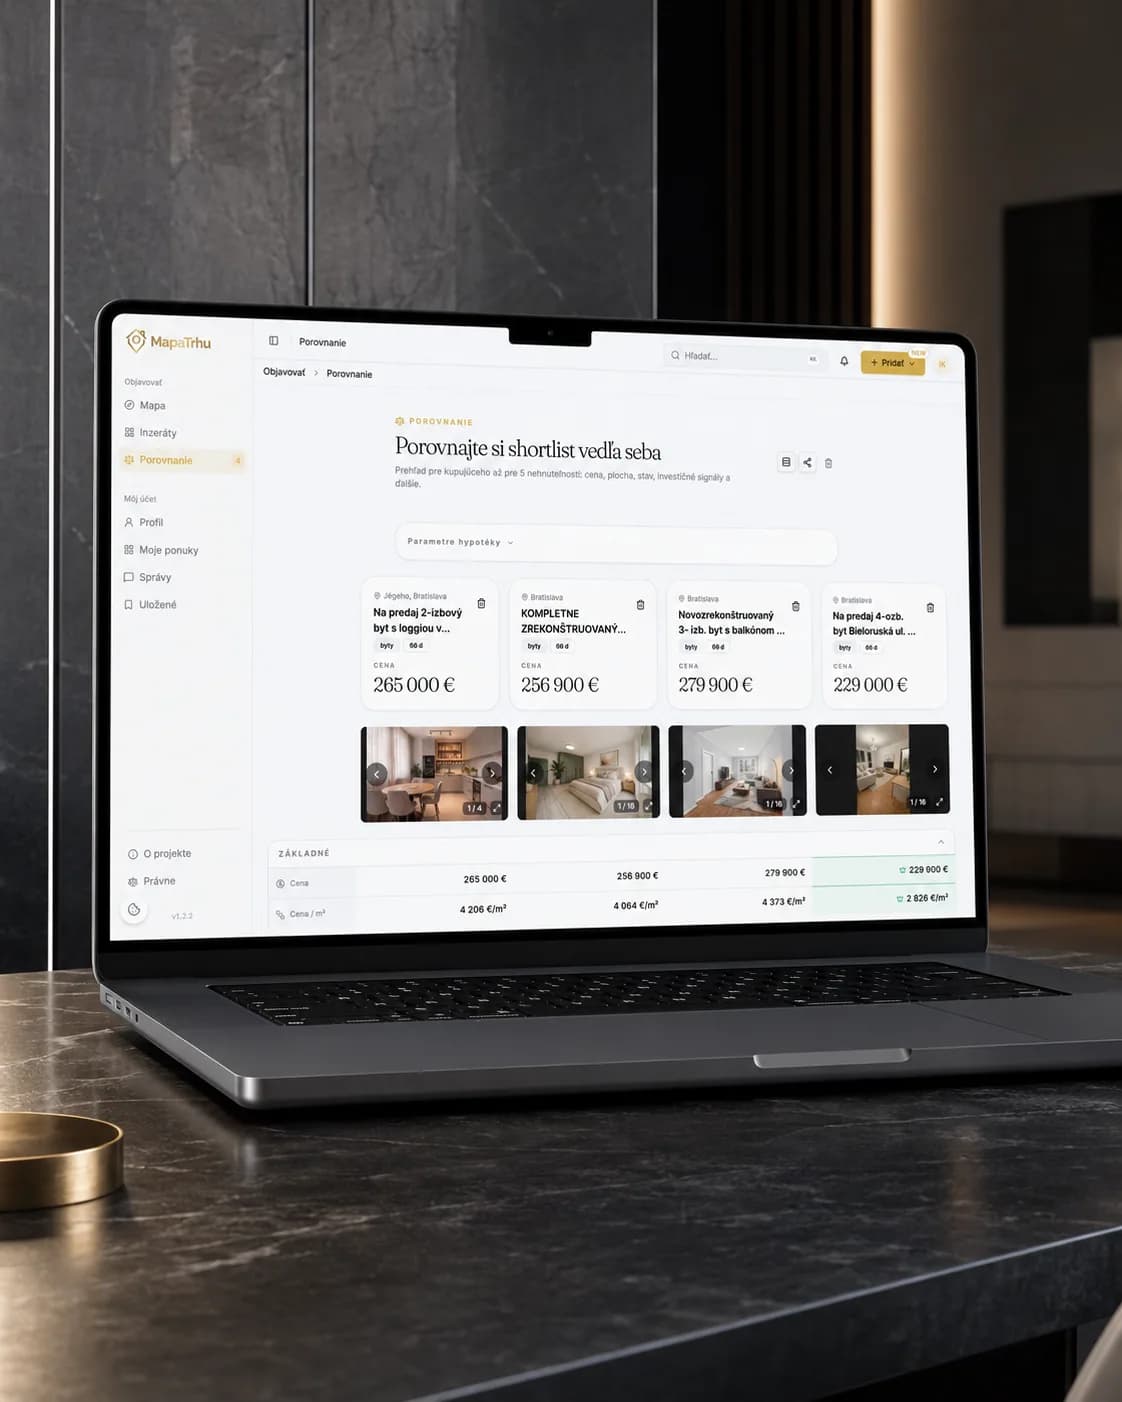
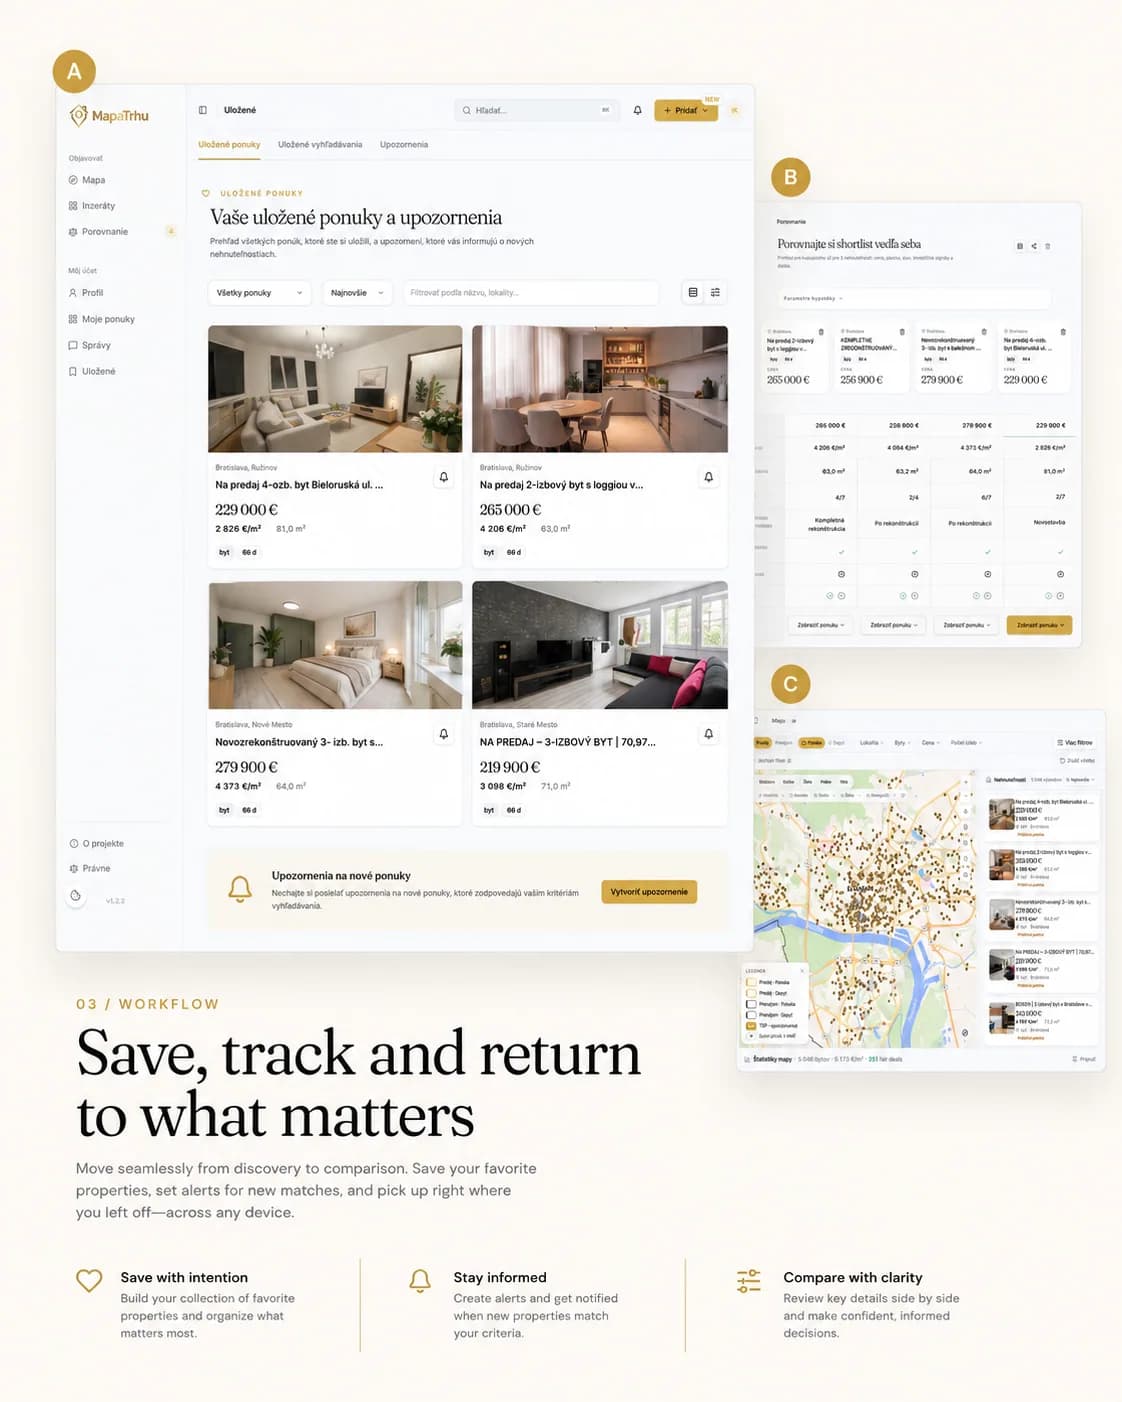
Listings can be saved, followed through alerts, and compared side by side. Consistent fields for every property turn a vague preference into a shortlist that can be reviewed.

05
A live data product
Listing collection and deduplication run on PostgreSQL and FastAPI. The map itself is MapLibre inside React. Rise owns product, design, engineering and ops, so interface and data layer move together.
Design and engineering
The decision journey shaped the system layers.
A listing keeps its origin, its identity and its price context through every movement of the map. Collection, calculation and public reads sit in separate layers so none of them slows the others down.
Decisions behind the architecture
From first filter to shortlist
We mapped buyer decisions and the information needed from the first filter through the shortlist.
Every listing keeps its source
We compared portal payloads and preserved the source of every listing and subsequent change.
The same property, one record
We designed a shared listing model and a deterministic key for linking the same property across sources.
One responsibility per layer
We separated raw capture, identity, calculations, and public reads so each can change and be checked independently.
The viewport drives the query
We profiled map queries and added a read model, caching, and scheduled jobs around real viewport use.
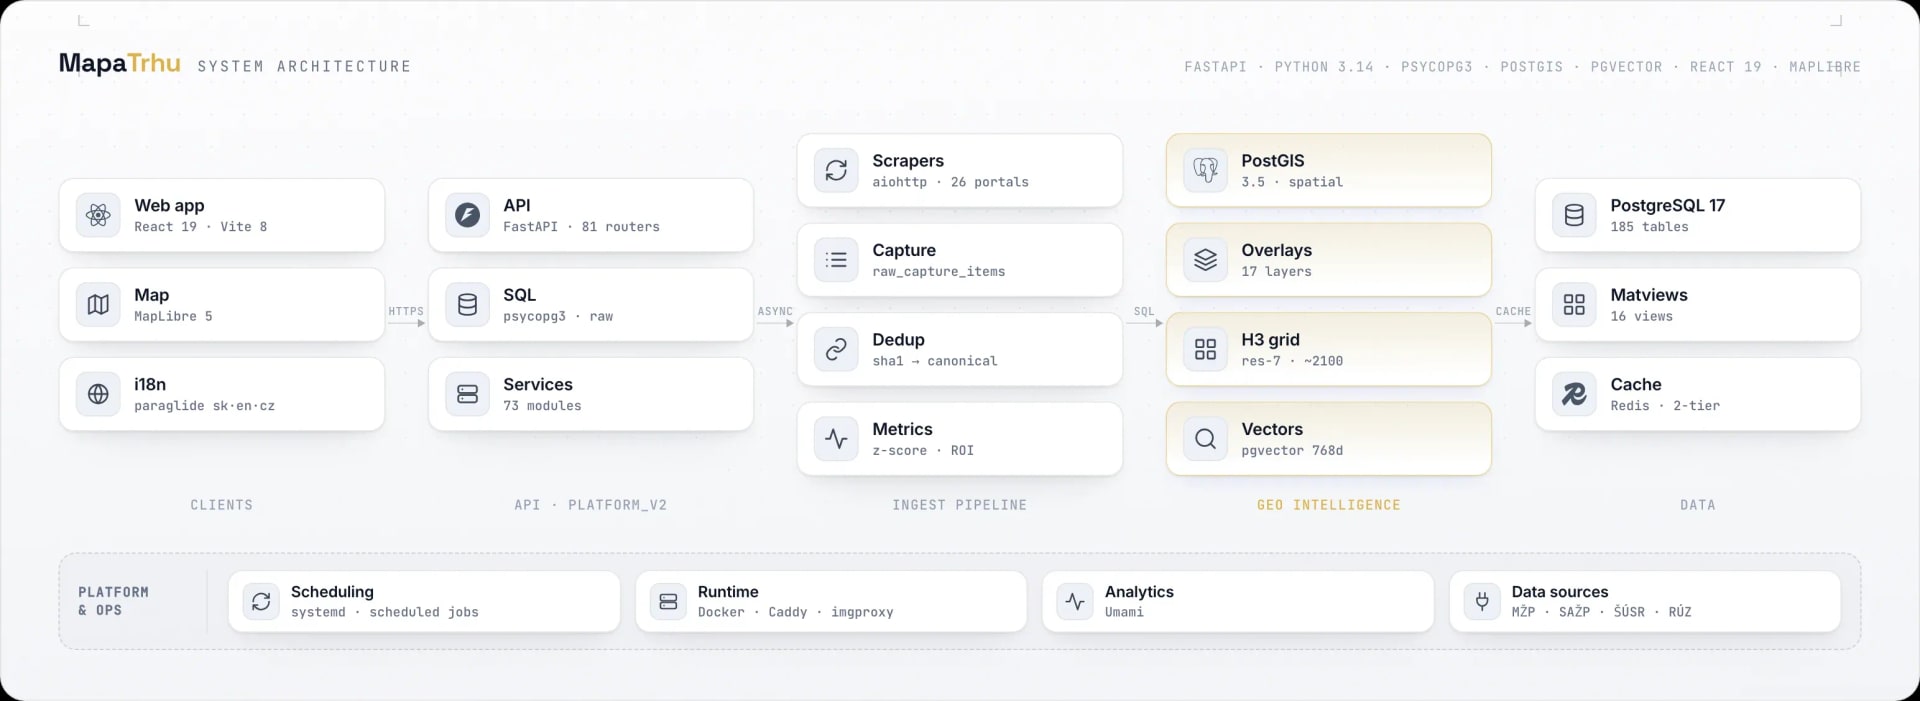
Scroll the diagram horizontally.
- 01
Client and map
React 19, TypeScript 6, Vite 8, MapLibre 5, TanStack Query, and Zustand keep filters, viewport, detail, and comparison in one state.
- 02
API and services
FastAPI in platform_v2 registers 81 route modules. Seventy-three services and raw psycopg3 separate domain decisions from SQL reads.
- 03
Ingestion and identity
aiohttp collectors read about 26 portals over HTTP, preserve the raw record, and deterministically link the same listings without losing provenance.
- 04
Geo intelligence
PostGIS 3.5 serves spatial selections, 17 layers, and an H3 resolution-7 grid. pgvector adds text retrieval and similarity.
- 05
Data and operations
PostgreSQL 17, Redis 8, materialized views, systemd jobs, Docker, Caddy, and imgproxy support fast reads and regular data refresh.
Listing data pipeline
Every listing passes through five controlled stages.
Raw portal data never reaches the map. A record keeps its source, gets normalized, is linked to the property it duplicates and picks up calculated signals. Only then does it enter the read model.
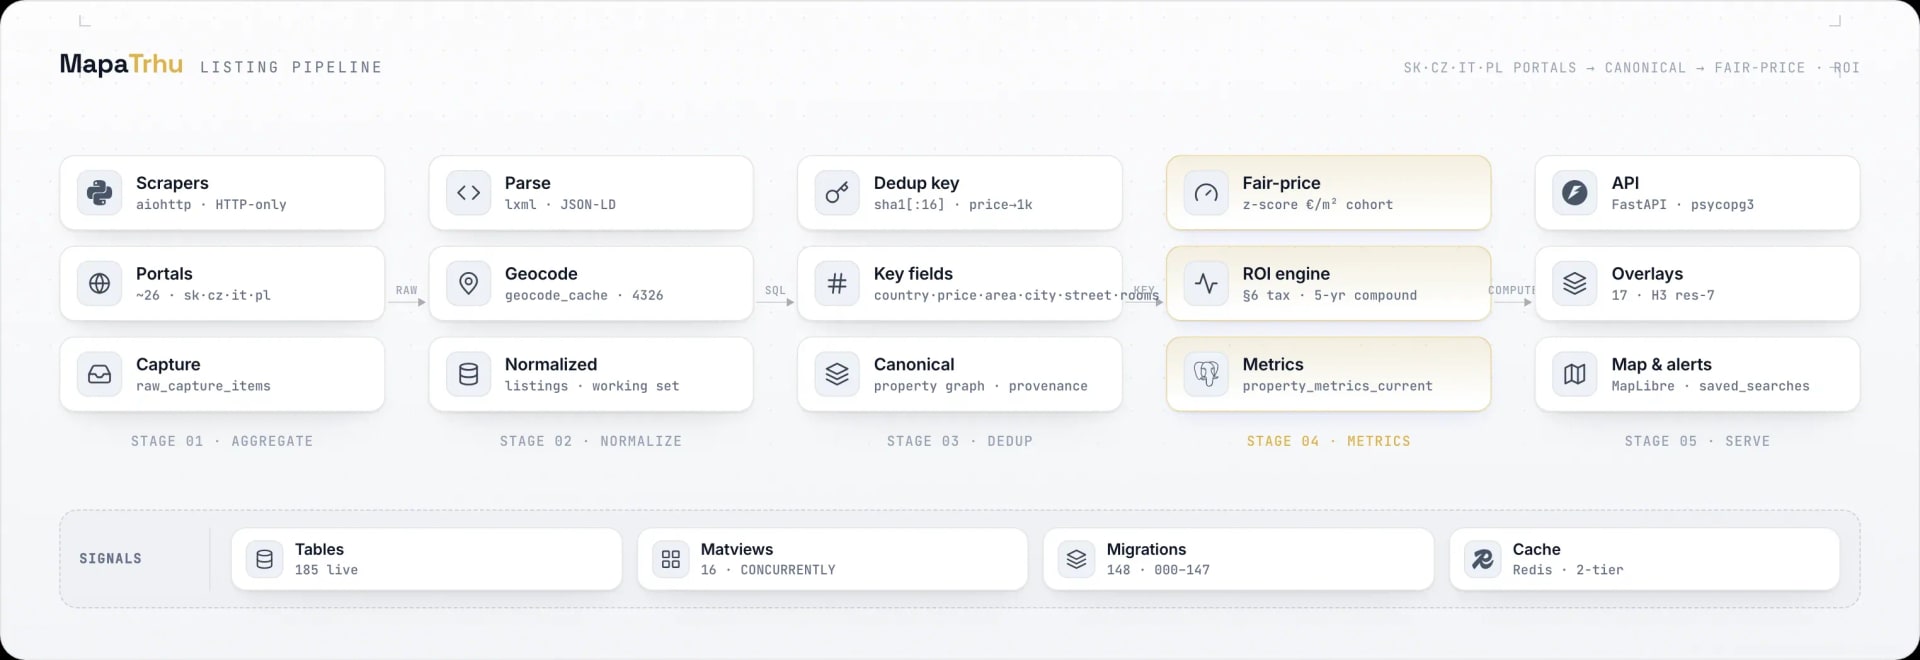
Scroll the diagram horizontally.
- 01
Capture the source
HTTP collectors for about 26 portals store the raw response and keep downloading separate from later processing.
- 02
Normalize
Parsing and geocoding turn different names, prices, areas, addresses, and coordinates into the shared listings working model.
- 03
Link identity
A SHA-1 key built from country, rounded price and area, city, street, and rooms links sources while preserving their history.
- 04
Calculate signals
A cohort price-per-square-metre z-score and ROI methodology populate property_metrics_current. The output remains an estimate with an explained source.
- 05
Serve the map
FastAPI, read models, and two-tier caching serve the MapLibre map, 17 layers, details, alerts, and saved searches.