Trnava transport development · Transport data
When a city’s movement becomes readable.
For Trnava, we created a private analytical application that brought city-bus and cycle-route data into one working view of the city.
- Year
- 2022
- Duration
- Six months
Information
- Year
- 2022
- Duration
- Six months
- Project type
- Private web application
- Our role
- We designed and built the application from scratch, including the transport data processing.
Technology
- Vue 3
- Python
- Leaflet
- Chart.js
- Quasar
What you will learn
- 01How to connect bus and cycling data without losing context.
- 02How to turn a map into an analytical workspace.
- 03How to separate data processing from a fast user interface.
01
One city, two kinds of movement
In 2022, data about buses, stops, tickets, and cycle counters arrived in different files. The six-month project turned them into one coherent working view.
01 / Under the surface
Architecture that protected context and privacy
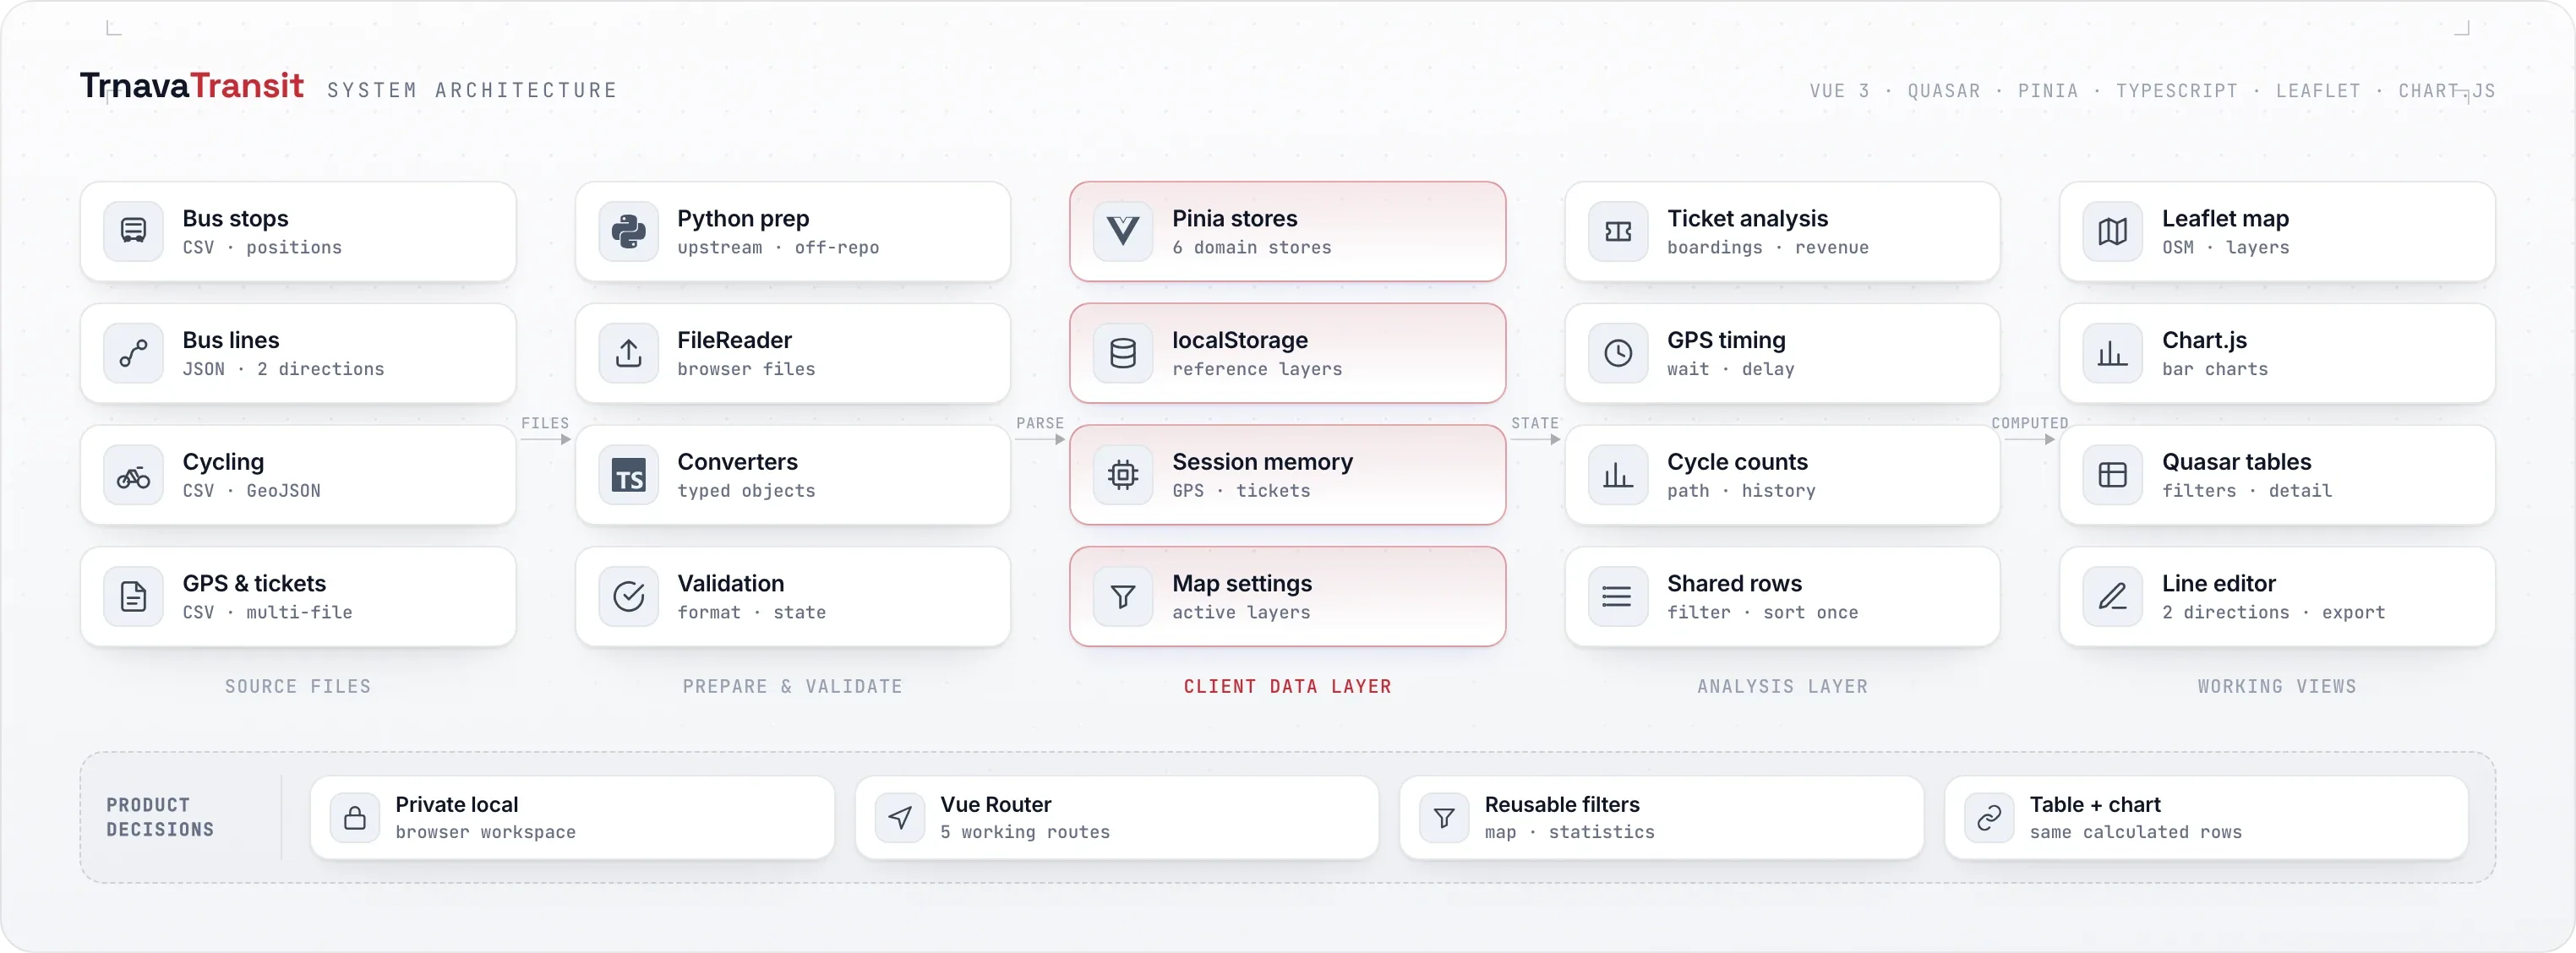
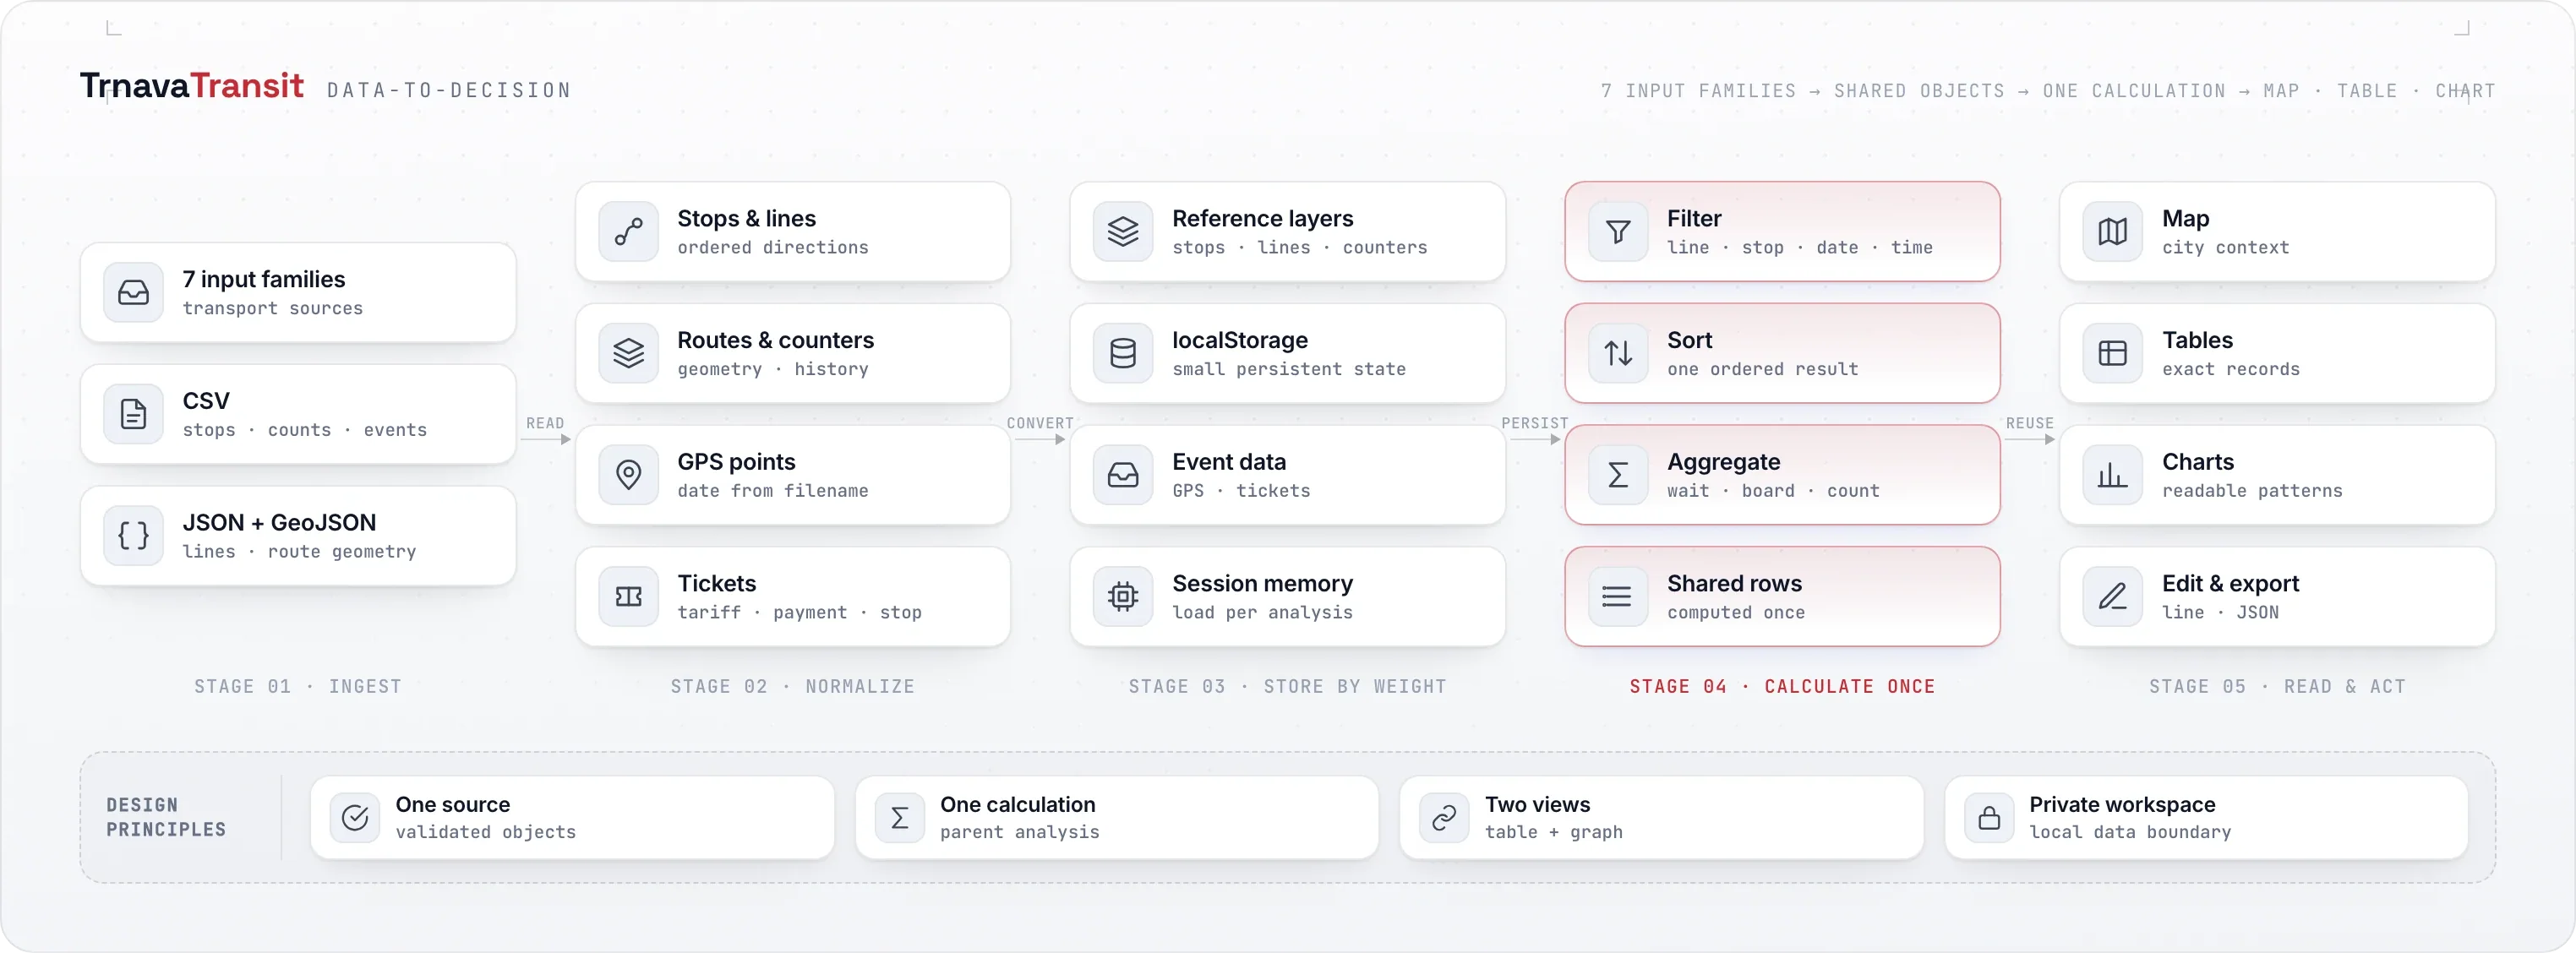
We separated the system into inputs, validation, a local data layer, shared calculations and the views people worked in. Smaller reference data stayed in the browser. Larger GPS and ticket records loaded only for the active session. Python supported upstream preparation outside the published Vue client.
02
Bus data on the map
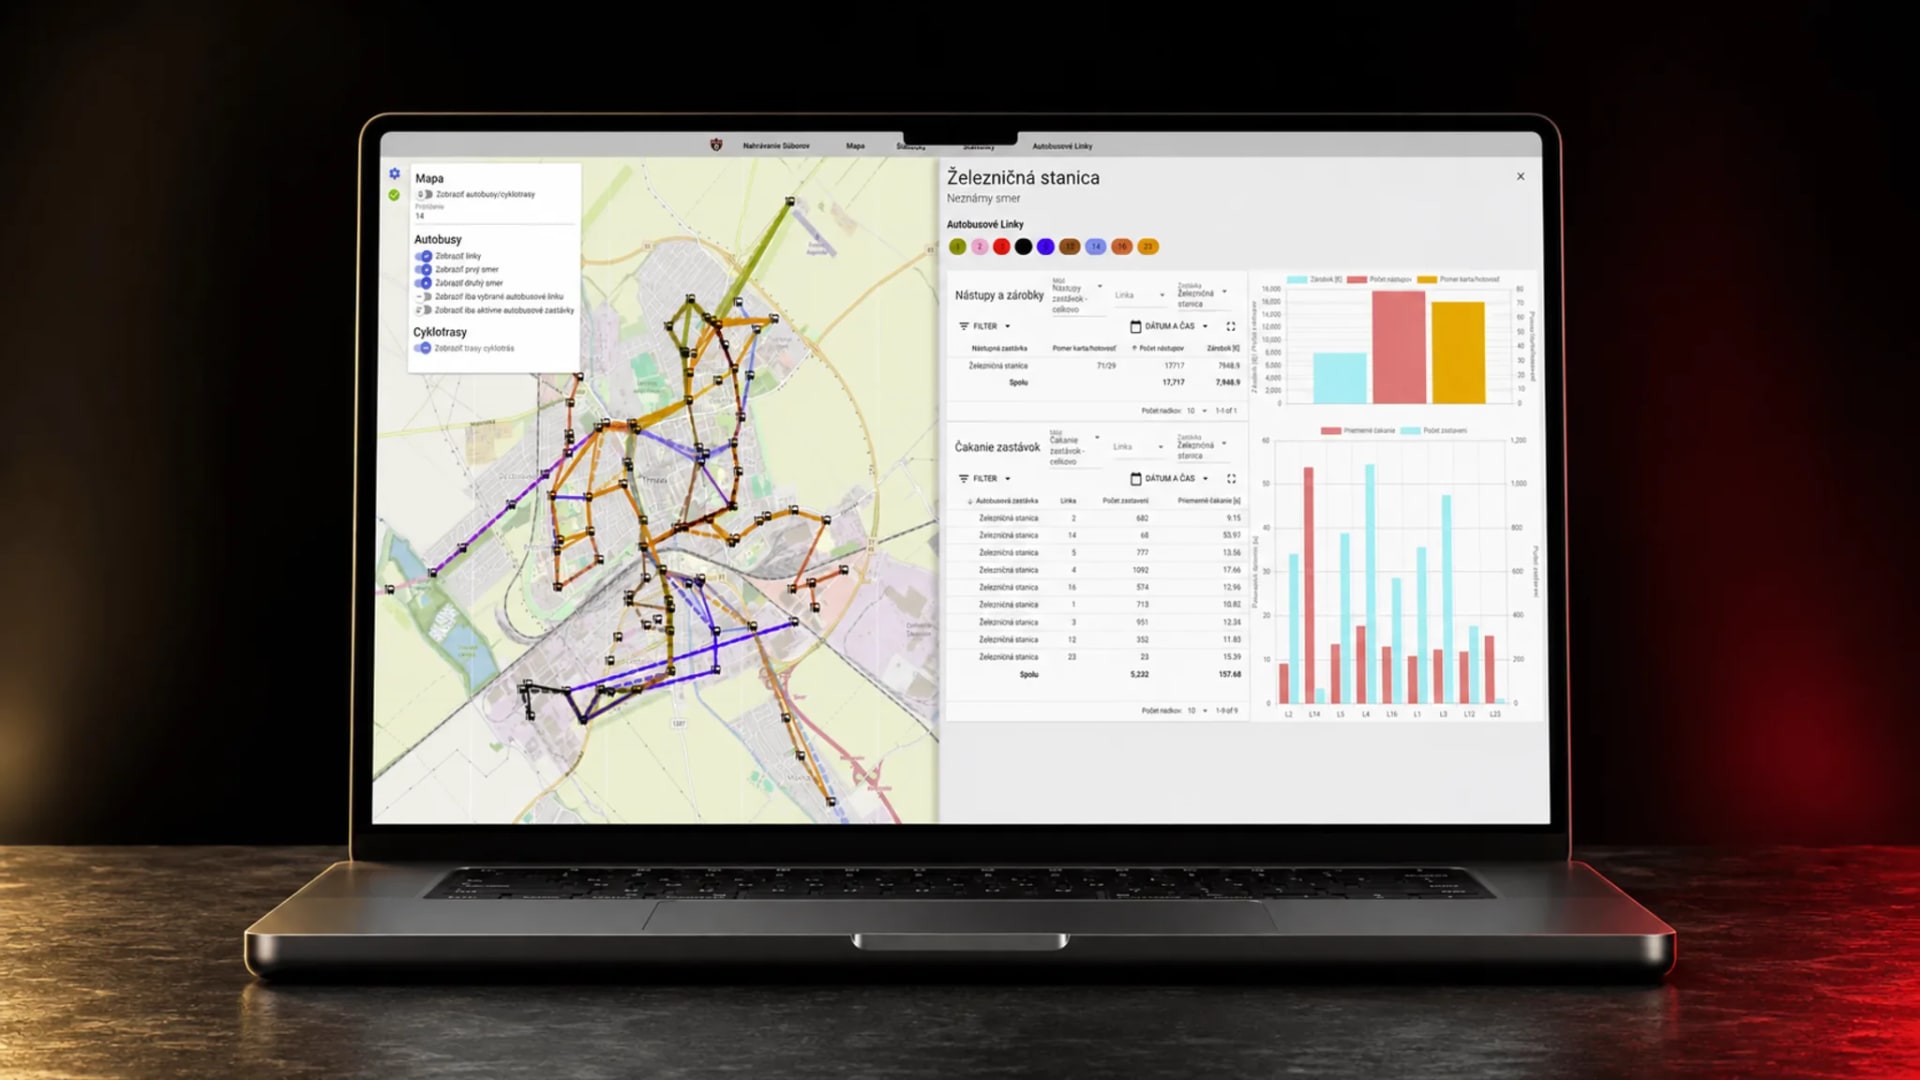
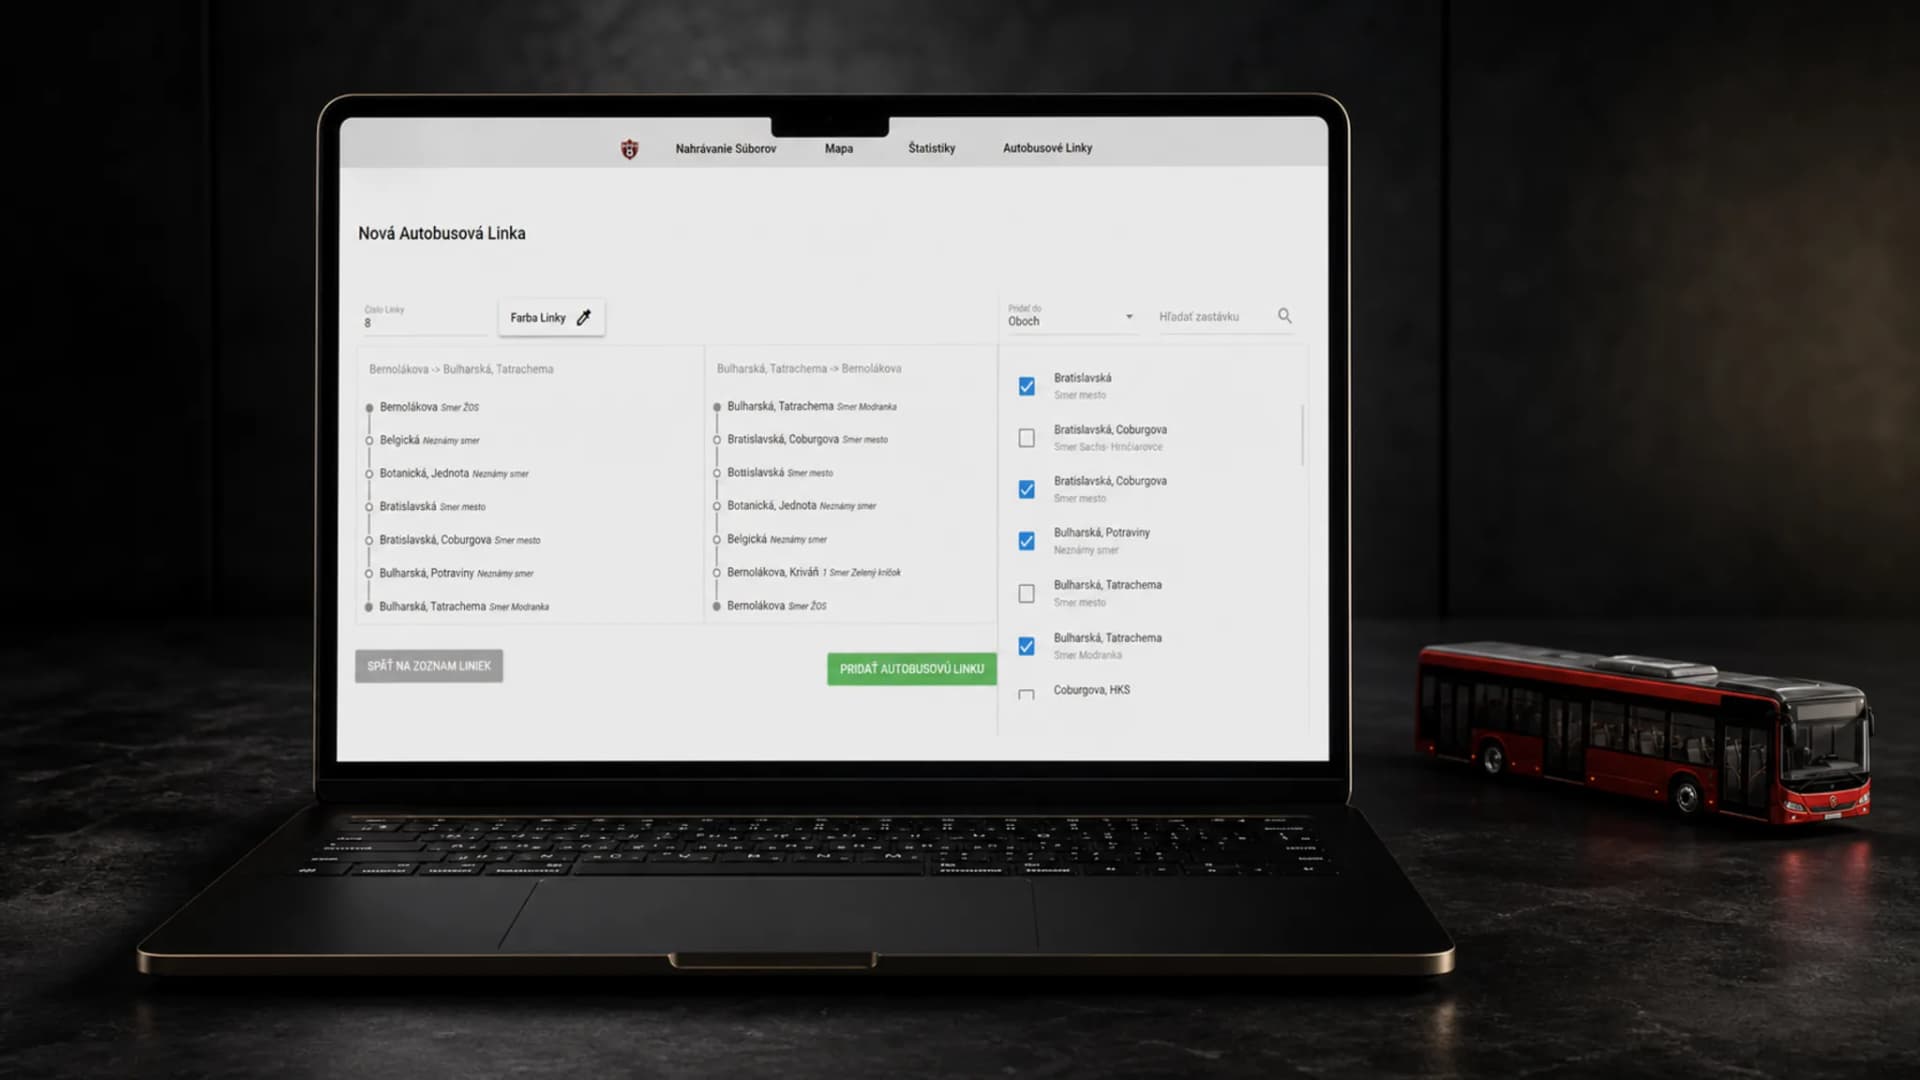
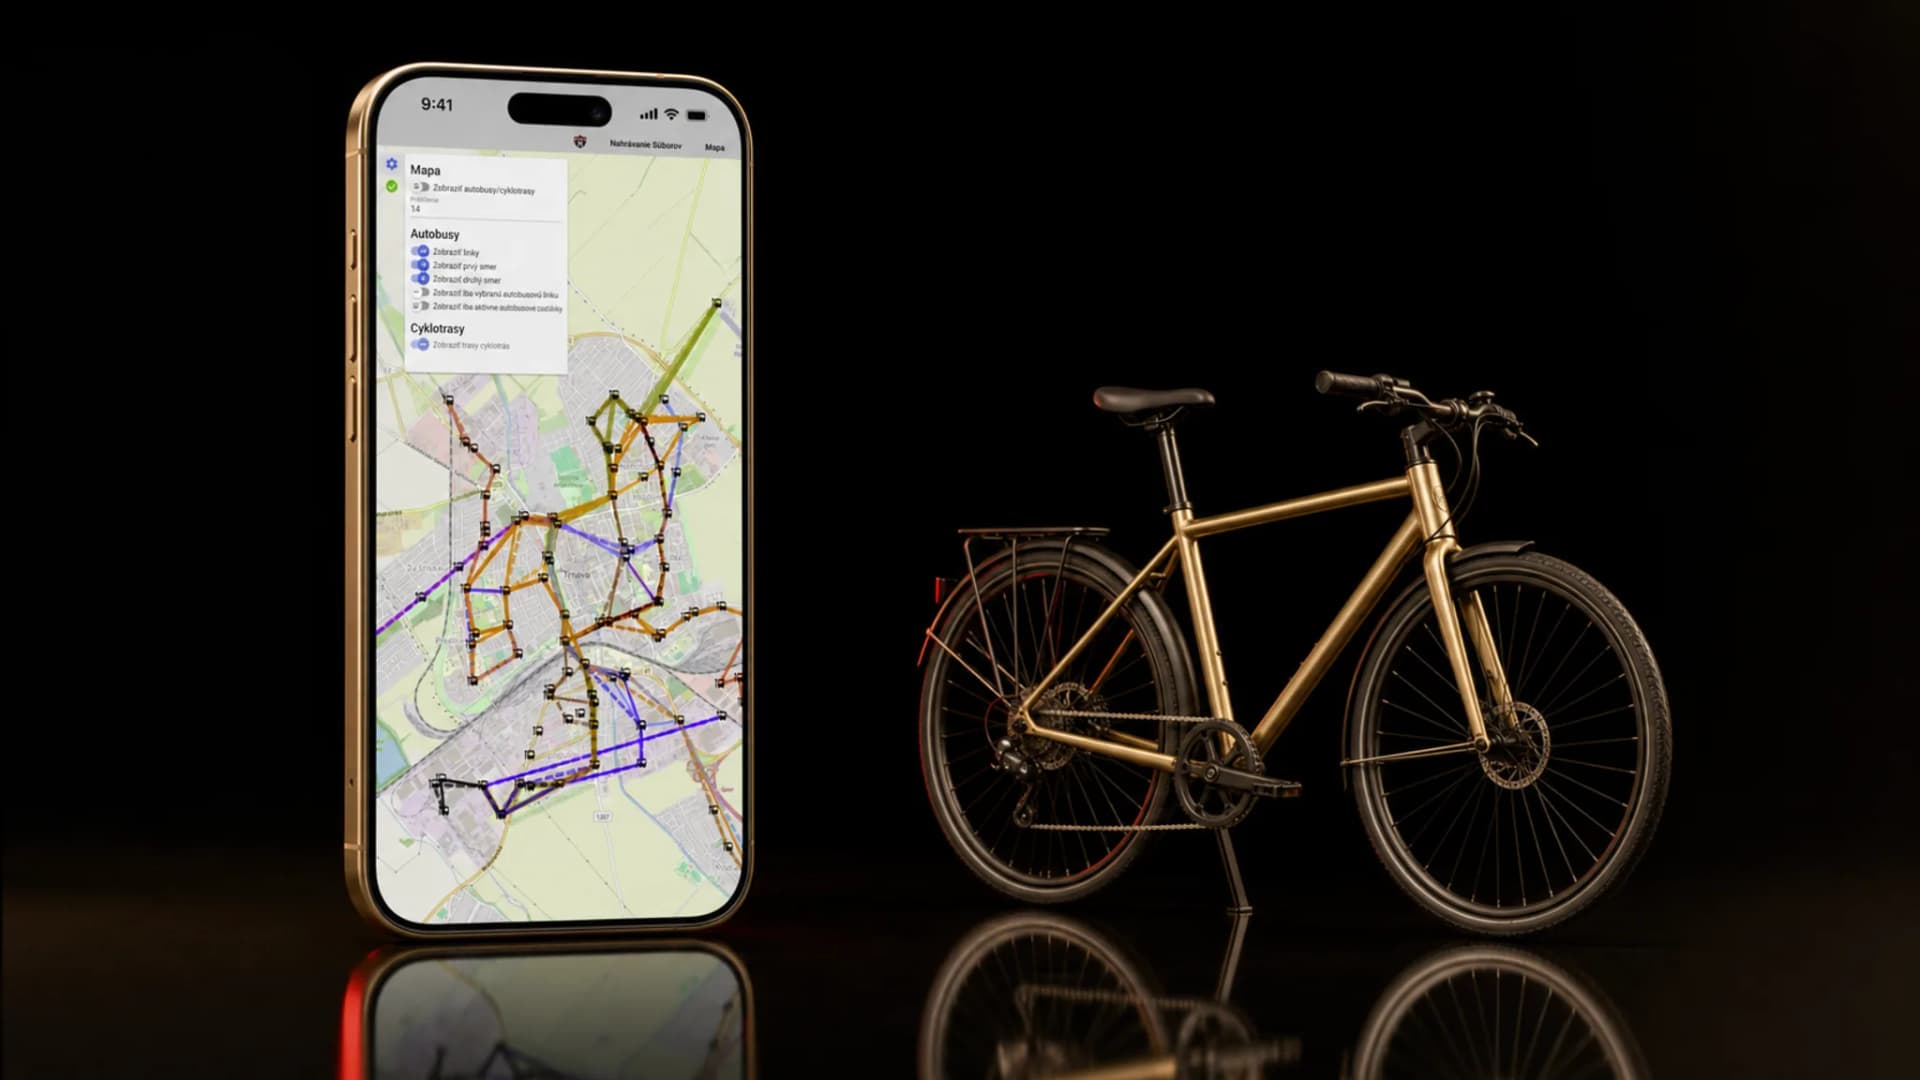
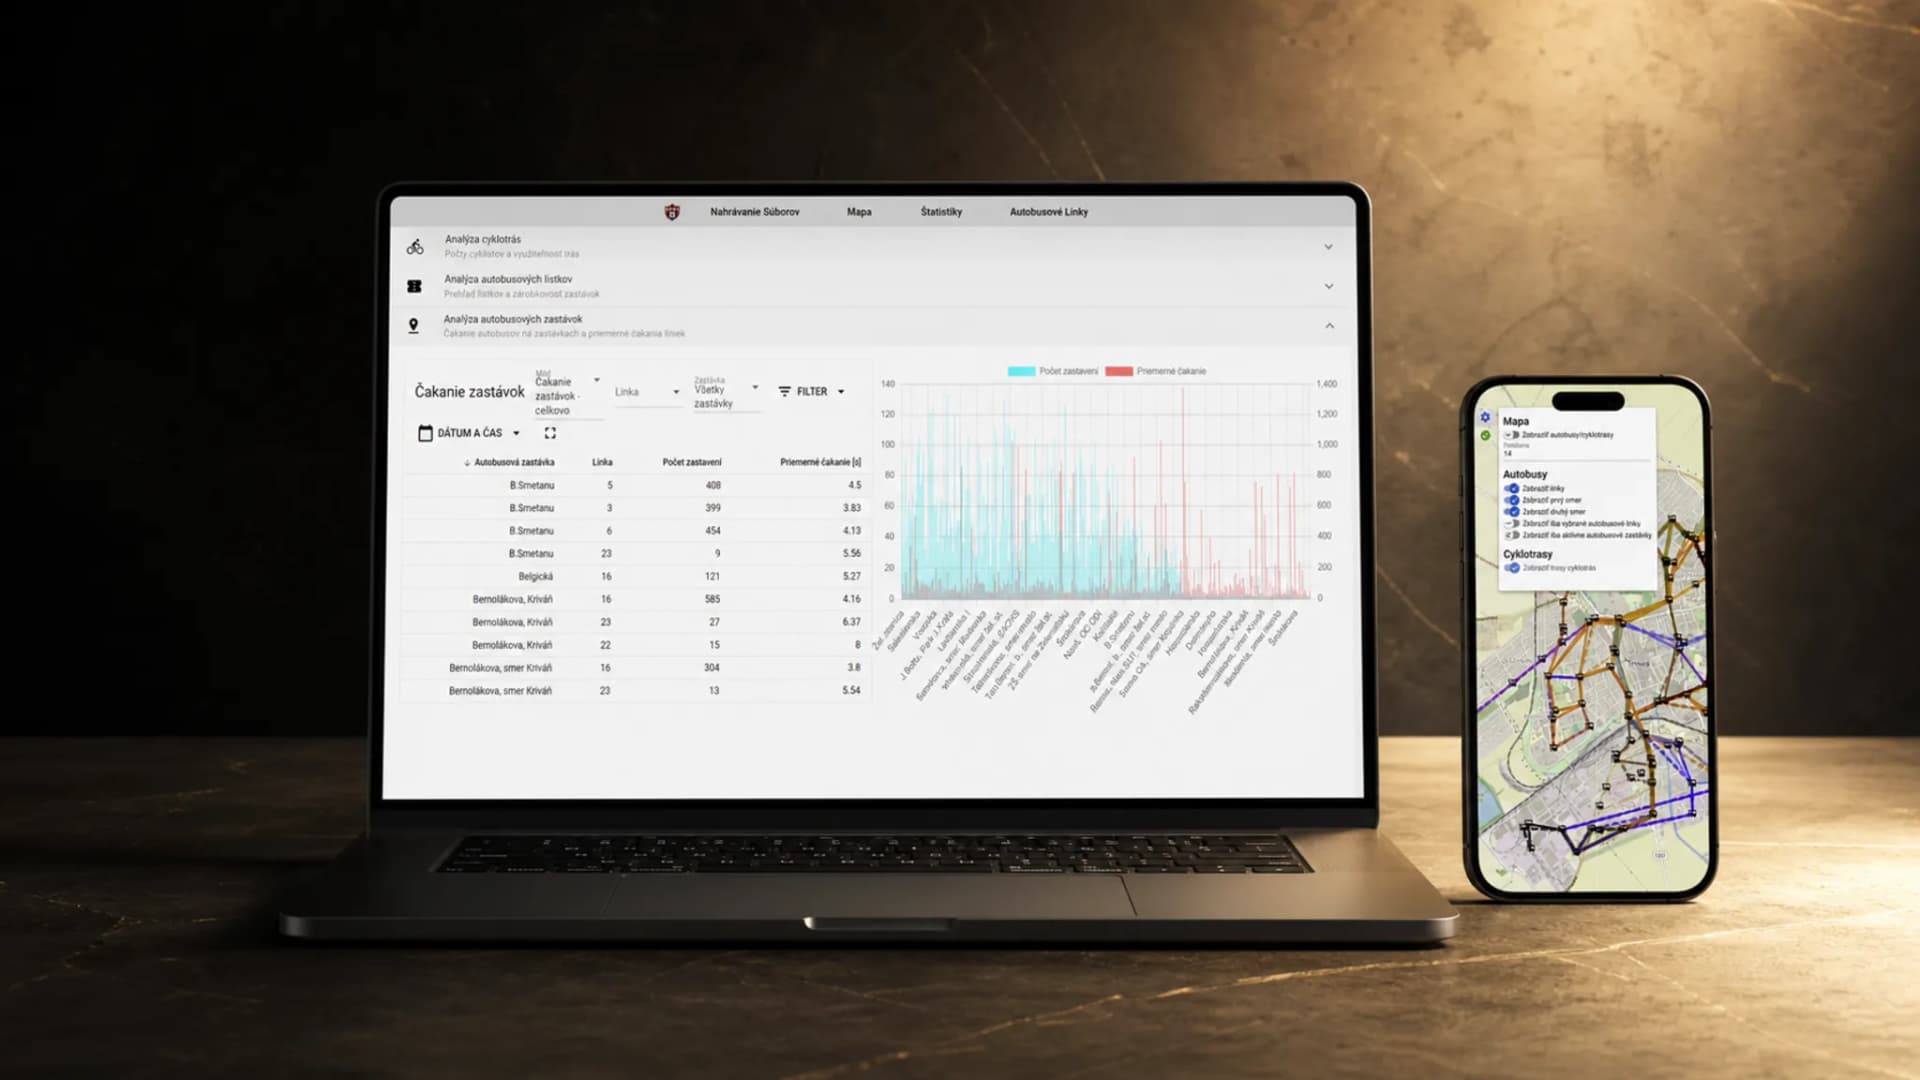
The map connected lines and stops with GPS timing, waiting, boardings, revenue, and the card-to-cash ratio. Filters moved the analysis from the whole city to a specific line or stop.
03
Cycle routes and counters on the same map
Cycle routes and counters used the same map logic as the bus network. Analysts could switch layers and inspect route use, then compare two kinds of movement in one city context.
02 / Analyst journey
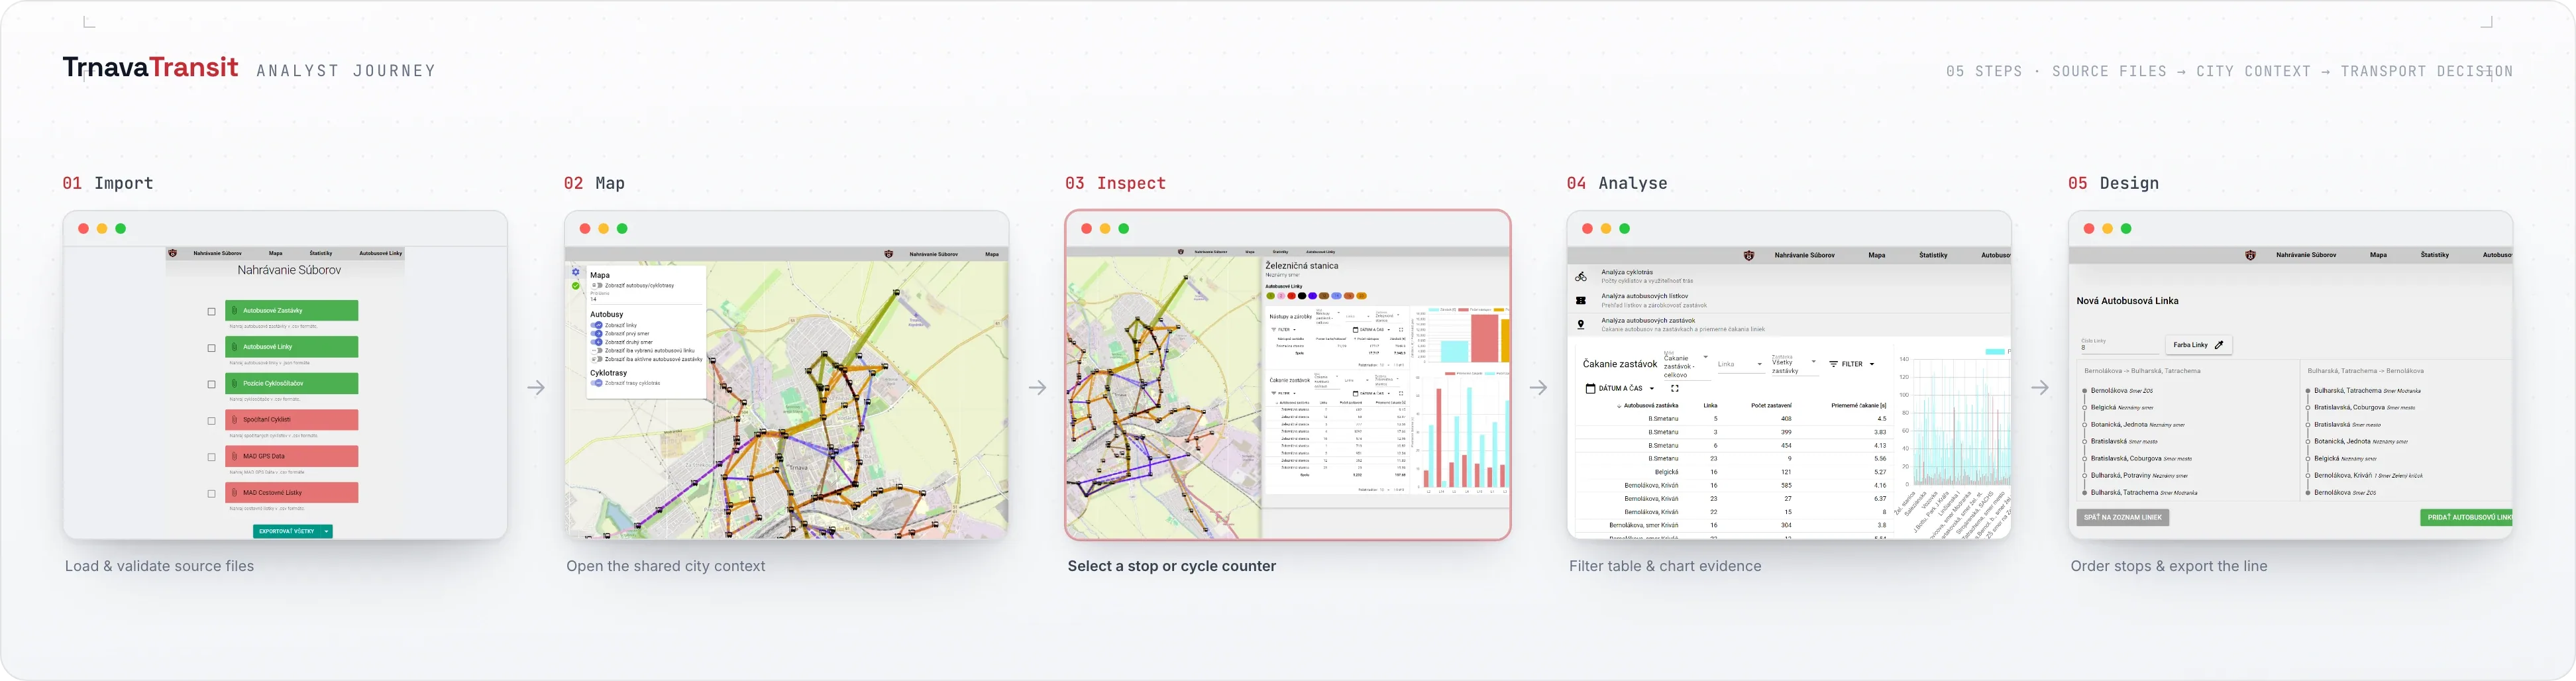
One journey from source file to an updated route
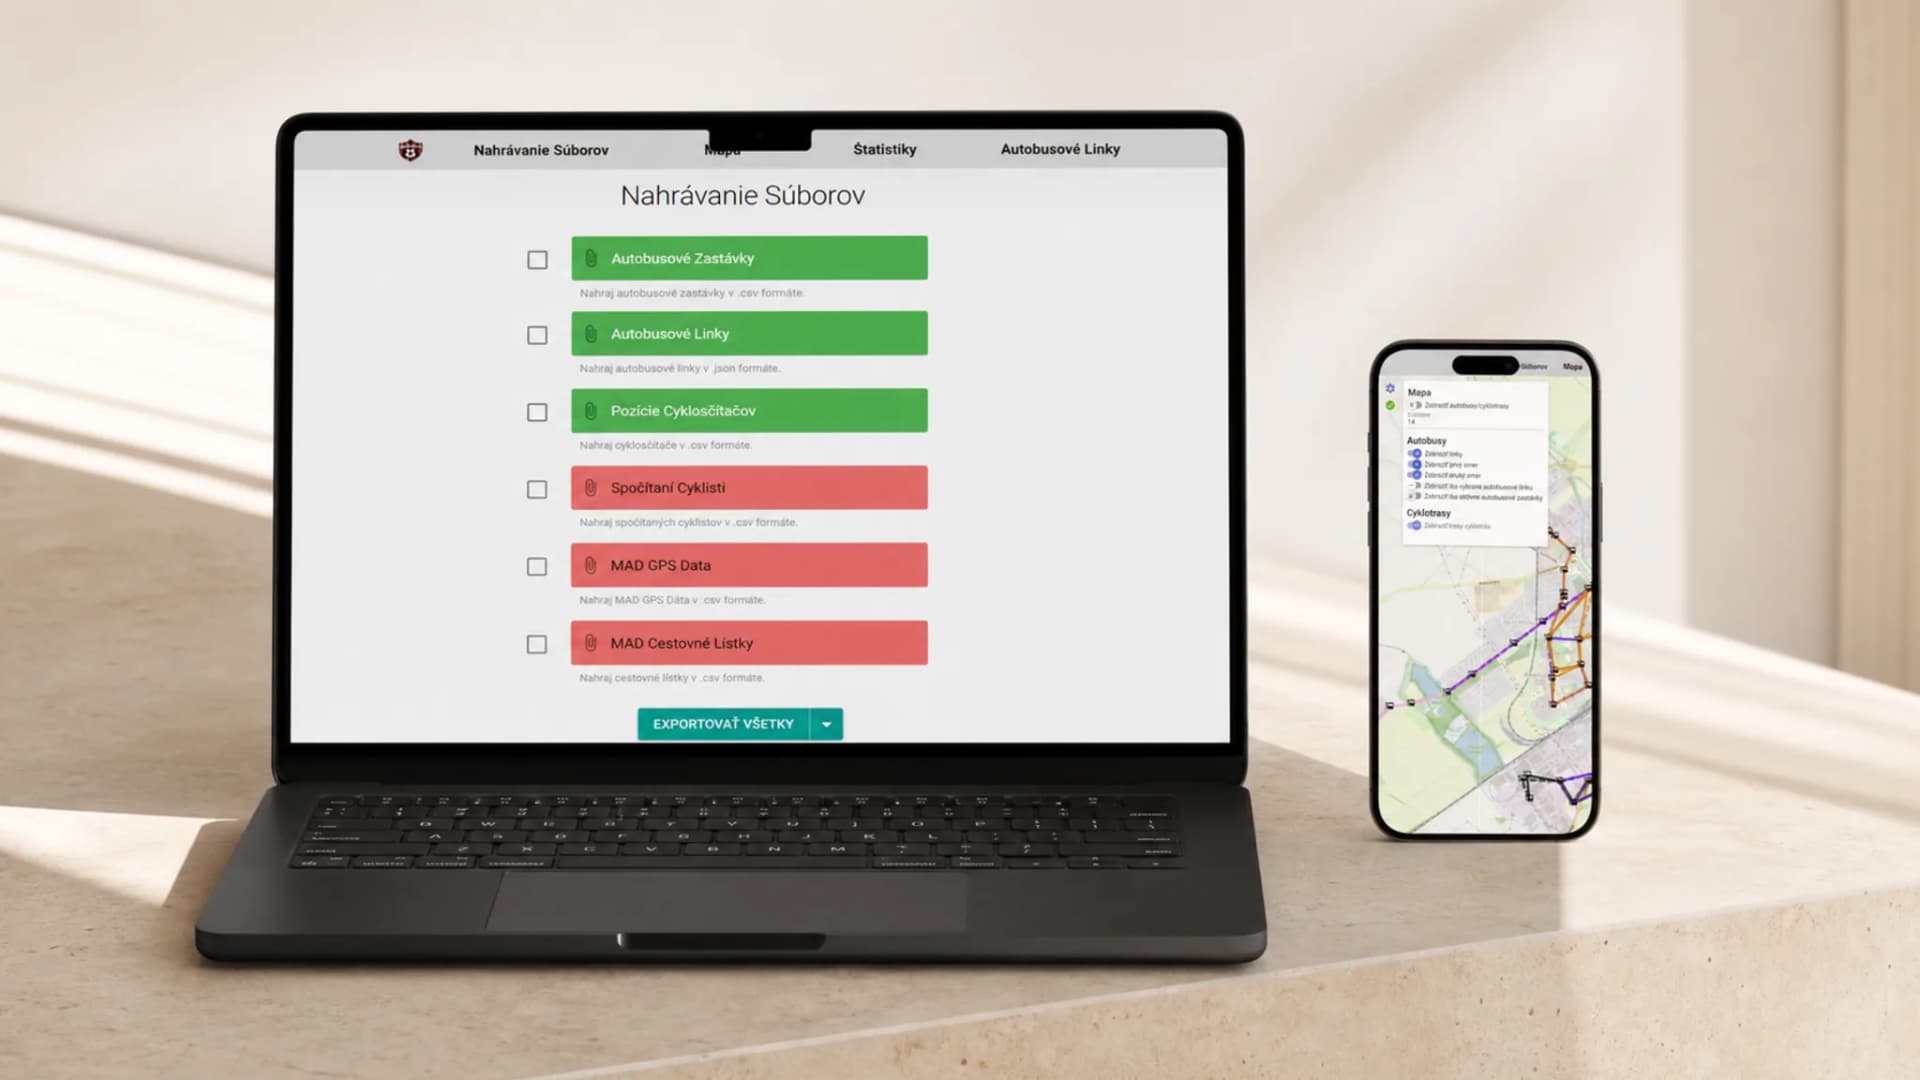
The analyst first checked the inputs, opened the shared map context, selected a stop or cycle counter, narrowed the question with filters, and then worked with a route or export. Every step used the same data rather than separately assembled reports.
04
Imports separate from the interface
Recurring CSV and JSON imports stayed separate from presentation. Python prepared the data while Vue 3 served it as maps and tables, and as charts that filter without rebuilding reports.
03 / Design principle
Calculate once, reuse the evidence everywhere
Conversion utilities turned different file formats into shared objects. The parent analysis layer then filtered, sorted, and aggregated the data once and passed the same result to both the table and chart. The interface stayed consistent without inventing a server layer.
From source files to a decision
Files and questions
We mapped the source files and the questions the analyst needed to answer.
One transport model
We defined a shared transport model and a clear validation boundary for every input.
The map keeps the context
We prototyped the map-to-detail-to-statistics flow so filtering never removed the city context.
One calculation, multiple views
We consolidated the calculations and documented the workflow, then verified the final handoff.
05
A shared transport-data workspace
The result was a private application where bus transport and cycling infrastructure could be explored side by side. The city gained one consistent workspace for its transport data.
“The data began to tell one story about how the city moves.”